Introduction
Anaerobic Digestion (AD) is an environmentally friendly technology, in which the organic materials of a biomass are decomposed by microbial consortia under anaerobic conditions to generate products of value. AD has a lesser environmental impact when compared to other waste disposal processes, such as landfill or incineration (Achmon at al., 2019). The impacts have been found to be influenced by the type and source of the feedstock, storage of the digestate and its application to the land (Whiting & Azapagic, 2014). Its use displays many benefits, such as small- or large-scale application, the generation of a gaseous biofuel that can be used as an energy source and the production of bio-fertilisers (Castrillón et al., 2011, Ware et al., 2017). Biogas production and its use for obtaining energy has been demonstrated as a viable option (Muthu et al., 2017). Biogas is a mixture of methane (60-70 %), carbon dioxide (40-30 %), and other gases like hydrogen sulphide (H2S), ammonia, nitrogen and hydrogen. AD of generated organic waste is common practice in developed countries, although poor performance of biogas generation can hinder the profitability and implementation of these systems. It has been discovered that anaerobic co-digestion (AcoD) of livestock manure with other substrates could increase the performance of biogas generation (Imeni et al., 2019, Almomani et al., 2020, Kasinath et al., 2021). The crucial point for the kinetic evaluation in AD analysis is the curve for methane accumulation over time obtained from the Biochemical Methane Potential (BMP) test. This serves as a valuable analytical technique to assess both the capacity for biological methane generation and the degradability of substrates (Santos et al. 2022).
It was also identified that, in order to improve the performance of digesters and gain knowledge about the process, dynamic modelling describing AD is required (Elagroudy et al., 2020). The mathematical models are generally based on equations that describe how the velocity of the chemical reactions depends on the substrate concentration (Pererva et al., 2020).
Various research studies have demonstrated the suitability of combining BMP test data with microbial growth models, including first-order, second-order, and modified mathematical models such as Richards, logistics and Gompertz (commonly used ones). This approach effectively describes the anaerobic fermentation process of various biomasses and allows kinetic parameters to be obtained that are consistent with experimental data (Achinas et al., 2019, Nguyen et al., 2019, Almomani et al., 2020, Tian et al., 2020, Elagroudy et al., 2020, Li et al., 2020, Pečar et al., 2020, Santos et al. 2022. Roberts et al. 2023, Hakimi et al. 2023, López-Aguilar et al. 2023, Alkhrissat 2024). The usefulness and practicality of such models should be reconsidered and verified on a wide variety of experimental curves (Pererva et al., 2020).
Alkhrissat et al. investigated the influence of various organic loading rates on the anaerobic digestion of cow manure. They observed an increase in methane production with higher organic loading and noted that the modified Gompertz and Logistic models showed strong consistency with experimental findings (Alkhrissat et al. 2024). The Gompertz model offers an equation describing cell concentration during fermentation over time, yet its implementation can be challenging with complex substrates. Similarly, the Logistic model faces limitations in implementation when dealing with complex substrates (Roberts et al. 2023). The differential equations in both models describe the rate of change observed in biogas production, and these models were adjusted to derive parameters of microbiological relevance (Zwietering et al. 1990). The logistic function follows the general pattern of biogas production kinetics, characterised by initial exponential growth and subsequent stabilisation at a maximum production level (Li at al. 2018). This model assumes that the rate of biomethane production is proportional to microbiome activity, as indicated by the amount of methane produced and the substrate concentration. Similarly, the Gompertz model posits that the gas production rate is proportional to microbiome activity, although the proportionality parameter decreases over time, following first-order kinetics due to diminishing fermentation efficiency (Altaş, 2009).
The research conducted by Nguyen et al. involved the analysis of experimental data using four kinetic models. They found that the Cone model effectively described the biomethane yield and methane production rate for various substrates, including livestock farm, cattle slaughterhouse, and agricultural waste streams, especially under thermophilic AD conditions. The study’s results highlighted the significant potential of model organic wastes in generating biomethane. According to Li et al., the Cone model demonstrated superior alignment with experimental data from anaerobic digestions of pig manure, dairy manure, chicken manure, and rabbit manure. The derived parameters indicated that anaerobic digestion of manures at higher loading rates results in a longer lag phase and lower hydrolysis rate (Li et al. 2015).
A study investigated the use of plant herbs, specifically serai wangi and peppermint, for their insect repellent properties in the context of AD using chicken manure. Flies are typically attracted to the digestate produced from chicken manure, hence the selection of these herbs. The study conducted a comprehensive kinetic analysis of AcoD of serai wangi, peppermint, and chicken manure. The modified Gompertz, logistic, and Cone models were employed due to their high R2 values (0.927–0.999) and minimal prediction error (<10.00%) in predicting methane production. The Modified Gompertz, Logistic, and Cone models find extensive application in assessing the biological attributes of AD due to their characteristic “S” shaped curves. These models effectively capture the three stages of fermentation, which encompass the lag phase, exponential phase, and stationary phase (Hakimi et al. 2023).
According to Roberts et al., their study evaluates five kinetic models for predicting methane yield during anaerobic digestion of orange and banana peels: Gompertz, logistic, first-order, Richards, and transfer models. Results suggest that the Gompertz and first-order kinetic models are the most accurate in predicting total methane yield, daily methane production, and time to reach maximum methane yield when compared to experimental data for orange peels (Roberts et al. 2023).
Another investigation utilized the modified Gompertz model and the first-order kinetic model to forecast biogas production yield when okra was used as the substrate. Both models factor in variables such as potential methane production, maximum production rate, digestion time, and lag phase, all of which contribute to the overall methane accumulation over time. The substrate underwent diverse treatments and underwent co-digestion with sheep slurries. Upon comparing projected outcomes with actual results, it was found that the first-order kinetic model yielded the most precise predictions, showing minimal deviation from the observed data (Ugwu, 2019).
The development of biogas processes greatly depends on scaling estimates. Analysis methods like lifecycle and cost analysis require simple scaling methods for analysing new technologies. Furthermore, a suitable model is essential for the design, process enhancement and operation of the systems in the long term (Nguyen et al., 2019). Despite the considerable number of publications dedicated to BMP testing and the numerous attempts to standardise procedures, there is no “one size fits all” mathematical model to accurately describe biomethane formation kinetics (Pererva et al. 2020). The objective of this work is the comparative evaluation of five empirical kinetic models, to describe the production of biogas in experimental prototype AD reactors at room temperature, using farming waste from both the meat and dairy industries.
The findings from this study enhance our understanding of the kinetics involved in biogas production from agricultural waste under realistic operating conditions, thereby contributing valuable insights into the field of anaerobic digestion and sustainable waste management. This enables researchers and practitioners to identify the most suitable model(s) for predicting biogas yield under different conditions, thereby contributing valuable insights into optimising anaerobic digestion processes and improving overall system efficiency.
The information obtained is useful for evaluating the use of organic waste for biogas production as part of an economic value chain that can contribute to mitigating the energy crisis.
1. Materials and methods
Raw material and inoculum
The raw material used in the study was:
- In the case of the study of meat industry waste the following were used: Holstein cow excrement and tripe waste from the cold meat food industry (28°58’21”N, -106°11’89”W). Mechanical pretreatment of crushing was carried out to reduce the size of the tripe.
- In the case of the dairy industry the following were used: beef cattle excrement and whey waste from the creation of Chihuahua brand cheese (27°37’25”N -105°14’55”W). The main components of this type of subproduct from the dairy industry are lactose, proteins and mineral salts (Navarro et al., 2014).
- In the case representing rural livestock systems Holstein cow and quarter racehorse manures were used (28°35’24”N 106°07’06”W).
The inoculum used to start up the reactors originated from the mesophilic (37 °C) anaerobic digesters from the North Plant waste water treatment .in Chihuahua City. The livestock manure was collected in polypropylene bags. The whey, colostrum and inoculum were collected in 2 litre polyethylene containers for subsequent transport to the laboratory.
1.1. Experimental configuration
Five experimental cases were analysed: 1) AD of inoculum (control), 2) AD of cattle manure, 3)AcoD of cattle manure/tripe, 4) AcoD of whey/cattle manure and 5) AcoD of colostrum/cattle-equine manure. The first two were used for comparative analysis and the remaining to represent the use of waste from the meat industry, dairy industry and rural livestock regions respectively.
Prototype biodigesters were built using high density polyethylene (HDPE) containers with a capacity for 20 litres. Each AD system was hermetically sealed, a PVC pipe was used to join the inside of the biodigester with the ball valve for opening and closing, and a pressure gauge was installed to measure the pressure of the biogas produced.
It was shown that the inoculum is one of the most important factors in AD. The suitable substrate-water-inoculum ratio can be derived from the process under stable operation (Yan et al., 2019). The inoculum to substrate ratio (ISR) in weight was established at a value of two, as this is considered the optimal value for biogas production (Achinas et al., 2019). This experiment did not consider whey or colostrum as substrate due to its low concentration of solids (less than 5%). The composition is shown in Table 1, % weight of components in the experimental cases.
Table 1
Component (W%) of the experimental ad systems.
|
Experiment / Components w% |
Substrate |
Water |
Inoculum |
Other |
|
AD of inoculum (control) |
- |
- |
100 |
- |
|
AD of cattle manure |
14 (cattle manure) |
58 |
28 |
- |
|
Anaerobic co-digestion of cattle manure / tripe |
15 (cattle manure) 5 (tripe) |
40 |
40 |
- |
|
Anaerobic co-digestion of whey/ cattle manure |
21.4 (cattle manure) |
14.4 |
42.8 |
21.4 (whey) |
|
Anaerobic co-digestion colostrum/cattle-equine manure |
11.375 (cattle manure) 11.375 (horse manure) |
9 |
45.5 |
22.8 (colostrum) |
The volatile solids (VS) of the biomass samples were characterised according to the Standard Method 2540 E (APHA, 2005) using the high precision scale model PCE-ABT 220L and a FELISSA oven.
Measurements for gas concentrations: CH4 and H2S, were taken periodically using measuring probe Landtec model 5000, each time the systems reached an internal pressure of 4 psi. A KG2 diaphragm gas measurer was used to measure the volume of biogas produced. The AD of the experimental prototypes was carried out in an exterior environment at ambient temperature to consider the effects of environmental temperature changes. The median maximum and minimum ambient temperatures during the experimentation period, were 27º and 7ºC respectively.
Based on the Biochemical Methane Potential (BMP) method the volume of CH4 produced was measured by VS mass of the substrates under equal experimental conditions for a period of 70 days. The BMP tests provided information on the substrate regarding the amount of material that can be degraded under experimental conditions and the degradation rate, as well as the materials’ potential biomethane performance (Ware et al., 2017).
The selection of the conditions under which the experiments were performed is justified based on several factors. Firstly, room temperature conditions were chosen to simulate practical operational environments commonly found in agricultural settings where anaerobic digestion processes occur. This ensures that the experimental results are applicable and relevant to real-world scenarios, hence enhancing the practical utility of the study.
Secondly, the use of farming waste from both meat and dairy industries as substrates reflects the typical feedstock sources in anaerobic digestion systems, making the study representative of actual biogas production scenarios. This selection allows for a more accurate assessment of the kinetic models’ performance in predicting biogas yield from commonly available agricultural residues.
1.2. Mathematical models analysis
The performance of the AD was described using the mathematical models: a) First Order kinetic (ER), b) Cone Model (CM), c) Modified Logistics (ML), d) Modified Gompertz (MG) and e) Modified Richards (MR) (Table 2). The Levenberg-Marquardt method was used to adjust the experimental data using the software CurveExper Professional 2.6.5, to solve the non-linear regressions and represent the kinetic behaviour of methane production.
The ER and CM models display two variables: the accumulated performance of methane “a” and the constant hydrolysis rate “B” which is the limiting factor for the anaerobic biodegradation process. In the cone model the parameter “D” provides information on the form factor.
The ML, MG and MR models enable the values associated with AD performance to be determined, such as the maximum methane production rate “b” given by the value of the derivative at the turning point shown on the accumulated biogas curve, considering that no biogas is generated during the lag phase. The lag phase time “c” is estimated by the intersection of the tangent line to the inflection point with the x axis. The accumulated maximum performance of biogas “a” is the highest value on the curve. The parameter “D” in the Modified Richards model is a parameter that is difficult to explain biologically (Pererva et al., 2020).
1.3. Data analysis and model evaluation
The Residual Sum of Squares (RSS) from the equations were compared for each one of the experimental cases, in order to select the best suited model. Furthermore, the determination coefficient (R2) was also considered, along with the standard regression error (S), in order to determine the correlation of the model with the experimental data, within a 95% confidence interval for the goodness of fit of the expected data (Tian et al., 2020). In addition, the second order Akaike information criteria test (AIC) was carried out to describe the relationship between the bias and the variance in the construction of the models (Akaike, 1974).
2. Results
The main result from the tests based on BMP methodology was the accumulated methane production curves, represented according to time (Ware et al., 2017). Figure 1 shows the experimental values and adjusted models for accumulated methane production, for the models: ER, CM, ML, MG and MR (Table 2) in the experiment: i) AD of cattle manure, ii) AcoD of cattle manure/tripe and Figure 2 shows the experimental values and adjusted models for accumulated methane production, for the models: iii) AcoD of whey/ cattle manure; iv) AcoD of colostrum/cattle-equine manure.
Table 2
Sigmoid models used to represent the kinetics of methane production.
|
Model / Equation |
Number of parameters |
Reference |
||
|
Maximum Exponential Rise (ER)
|
2 |
(Li et al. 2015, Velázquez-Martí et al. 2019, Pererva et al. 2020, Nguyen et al. 2018, Pitt et al. 1999, Roberts et al. 2023) |
||
|
Cone model (CM)
|
3 |
(Li et al. 2015, Velázquez-Martí et al. 2019, Pererva et al. 2020, Nguyen et al. 2018, Pitt et al. 1999, Hakimi et al. 2023) |
||
|
Modified Logistic (ML)
|
3 |
(Velázquez-Martí et al. 2019, Pererva et al. 2020, Nguyen et al. 2018, Pitt et al. 1999, Roberts et al. 2023, Hakimi et al. 2023, Alkhrissat et al. 2024) |
||
|
Modified Gompertz (MG)
|
3 |
(Pererva et al. 2020, Nguyen et al. 2018, Pitt et al. 1999, Roberts et al. 2023, Hakimi et al. 2023, Alkhrissat et al. 2024) |
||
|
Modified Richards (MR)
|
4 |
(Roberts et al. 2023, |
The CM, ML and MG present 3 constants that define the non-linear sigmoid correlation for adjustment to the experimental data, while the ER model has 2 constants and the MR model has 4 constants.
Figure 1
Experimental values and adjusted models for: a) AD of cattle manure, b) anaerobic co-digestion of cattle manure/tripe.
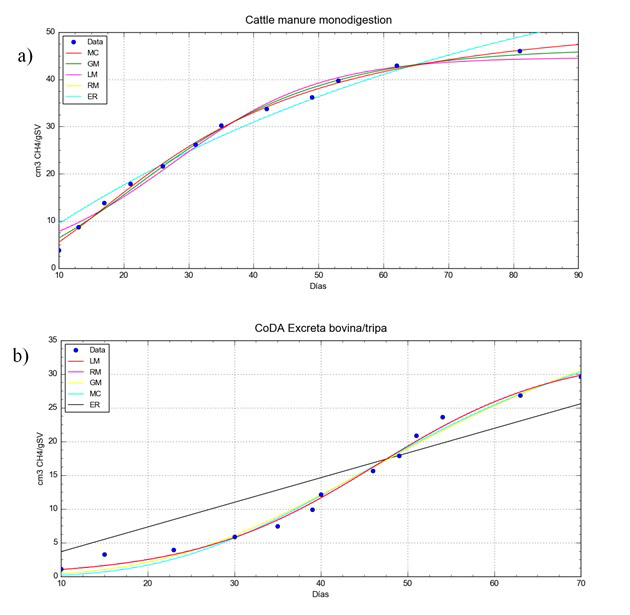
Figure 2
Experimental values and adjusted models for: c) anaerobic co-digestion of whey/cattle manure; d) anaerobic co-digestion colostrum/cattle-equine manure
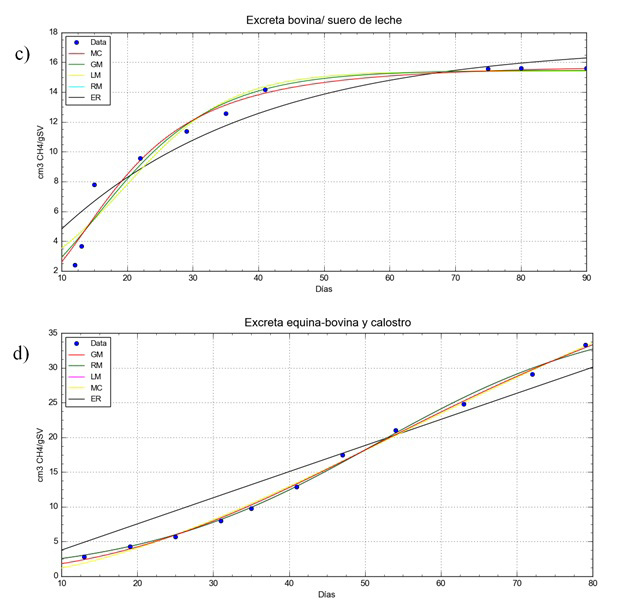
Table 3 shows the values for the adjustment parameters of the kinetic models for methane production (Table 2) with regard to the experimental values for the AD cases analysed. Where: “a” is the maximum methane production value, “b” is the maximum methane production rate, “c” is the lag phase time, “B” is the constant hydrolysis rate and “D” is a parameter of the curve form.
Table 3
Adjustment parameters of the kinetic models
|
Models (Table 2) |
a |
b |
c |
B |
D |
|
|
i) AD of cattle manure |
ER |
72.5578 |
0.0138 |
|||
|
MC |
53.7823 |
- |
- |
0.0318 |
-1.8966 |
|
|
LM |
44.6497 |
0.0983 |
4.9166 |
- |
- |
|
|
GM |
46.5948 |
1.0103 |
4.6548 |
- |
- |
|
|
RM |
44.6496 |
1.1278 |
1.5834 |
1.1521 |
||
|
ii) Anaerobic co-digestion of cattle manure / tripe |
ER |
9800.8 |
- |
- |
0.00003 |
- |
|
MC |
42.8119 |
- |
- |
0.01871 |
-3.2601 |
|
|
LM |
33.0101 |
0.7819 |
25.3061 |
- |
- |
|
|
GM |
43.1909 |
0.6879 |
22.5133 |
- |
- |
|
|
RM |
33.0101 |
0.5997 |
30.2739 |
- |
0.7790 |
|
|
iii) Anaerobic co-digestion of whey/ cattle manure |
ER |
17.1777 |
- |
- |
0.0328 |
- |
|
MC |
15.8761 |
- |
- |
0.05269 |
-2.5508 |
|
|
LM |
15.3887 |
0.4783 |
3.704 |
- |
- |
|
|
GM |
15.4574 |
0.5452 |
4.9095 |
- |
- |
|
|
RM |
15.3887 |
0.4962 |
3.0994 |
- |
1.0377 |
|
|
iv) Anaerobic co-digestion colostrum/cattle-equine manure |
ER |
9031.5358 |
- |
- |
0.00004 |
- |
|
MC |
90.2708 |
- |
- |
0.00939 |
-1.8274 |
|
|
LM |
37.9892 |
0.6049 |
19.9286 |
- |
- |
|
|
GM |
51.3428 |
0.5526 |
17.1175 |
- |
- |
|
|
RM |
37.9891 |
0.5583 |
22.3477 |
- |
0.9244 |
|
|
Units |
[cm3 CH4/g SV] |
[cm3 CH4/g SV] |
[days] |
[1/days] |
[--] |
|
Table 4 compares the prediction on day 70 for accumulated methane using the models, with that measured experimentally for the three AcoD cases and AD of cattle manure. Table 5 shows the statistical parameters for each of the experiments, considered to select the most suitable model for the studied phenomenon. Where: RSS is the residual sum of squares; R2 is the determination or correlation coefficient; AIC is second order Akaike information criteria that describes the relationship between the bias and the variance in the construction of the model; S is the standard regression error that provides the absolute measurement for the average distance of the values observed with respect to the regression line, in units of the dependent variable (days).
Table 4
Prediction at day 70 vs experimental values.
|
Experiment |
ER* |
MC* |
LM* |
GM* |
RM* |
Experiment at day 70* |
|
i) AD of cattle manure |
45.10 |
44.13 |
43.61 |
43.97 |
43.61 |
46.02 |
|
ii) Anaerobic co-digestion of cattle manure / tripe |
25.79 |
30.26 |
29.82 |
30.5 |
29.82 |
29.57 |
|
iii) Anaerobic co-digestion of whey/ cattle manure |
15.45 |
15.32 |
15.35 |
15.37 |
15.35 |
15.57 |
|
iv) Anaerobic co-digestion colostrum/cattle-equine manure |
26.35 |
28.63 |
29.12 |
28.79 |
29.12 |
29.58 |
|
* cm3 CH4/g SV |
Table 5
Statistical parameters for the evaluation of the kinetic models.
|
Models |
RSS |
R2 |
AIC |
S (days) |
|
|
i) AD of cattle manure |
ER |
67.8231 |
0.9674 |
23.1839 |
2.6042 |
|
CM |
8.3566 |
0.9959 |
0.9911 |
0.9635 |
|
|
ML |
35.0722 |
0.9831 |
18.2034 |
1.9740 |
|
|
MG |
16.0514 |
0.9922 |
8.8240 |
1.3354 |
|
|
MR |
35.0722 |
0.9831 |
21.87 |
2.0938 |
|
|
ii) anaerobic co-digestion of cattle manure / tripe |
ER |
163.411 |
0.8481 |
35.2707 |
3.8542 |
|
CM |
18.6766 |
0.9826 |
9.9101 |
1.3666 |
|
|
ML |
9.2377 |
0.9914 |
0.7585 |
0.9611 |
|
|
MG |
18.1333 |
0.9831 |
9.5254 |
1.3466 |
|
|
MR |
9.2377 |
0.9914 |
4.2252 |
1.0131 |
|
|
iii) anaerobic co-digestion of whey/ cattle manure |
ER |
21.403 |
0.9008 |
10.1095 |
1.6356 |
|
CM |
7.7032 |
0.9643 |
3.1047 |
1.0490 |
|
|
ML |
11.2729 |
0.9477 |
6.9124 |
1.2690 |
|
|
MG |
9.0308 |
0.9581 |
4.6948 |
1.1358 |
|
|
MR |
11.2729 |
0.9477 |
11.1981 |
1.3706 |
|
|
iv) anaerobic co-digestion colostrum/cattle-equine manure |
ER |
77.19901 |
0.9300 |
23.8775 |
2.9285 |
|
CM |
4.1737 |
0.9962 |
-5.1599 |
0.7222 |
|
|
ML |
3.9884 |
0.9963 |
-5.6593 |
0.7060 |
|
|
MG |
3.0157 |
0.9972 |
-8.7346 |
0.6139 |
|
|
MR |
3.9884 |
0.9963 |
-1.7308 |
0.7548 |
Monitoring carried out for 70 days for experiments i, ii and iii and the biogas sampling showed that:
- AcoD cattle manure - tripe:
- The maximum CH4 concentration in the sampling was 62.5 % on day 54, to maintain a concentration close to 61 % until the end of the experiment.
- For the first 15 days the H2S concentration exceeded 3000 ppm, and subsequently decreased and remained at 500 ppm.
- AcoD cattle manure - whey:
- The maximum CH4 concentration in the sampling was 42.5 % on day 15, and after day 22 methane production decreased significantly.
- From day 22 the H2S concentration exceeded 9000 ppm.
- AcoD colostrum-horse-cattle manure:
- The maximum CH4 concentration in the sampling was 62.5 % on day 3, and after day 60 it exceeded 60 % concentration.
- From day 25 the H2S concentration exceeded 5000 ppm, reaching a maximum of 6000 ppm on day 30. After day 46 there was a decrease in the presence of H2S down to 3000 ppm.
3. Discussions
It is observed in the experiments that the increase in H2S has a direct effect that reduces methane production. This is more apparent in experiments ii) and iii), and in the latter the H2S concentration remains high. According to Kehoe et al. (2007) a high quantity of sulphur is observed in the components in the colostrum. The use of methodologies such as controlled air supply and/or the addition of additives to the substrate can be useful for removing H2S in AD systems (Song, 2020; Ninhia, 2017).
The accumulated methane production quantities obtained were lower than those obtained by Moset et al. (2015) with 333.9, 283.8, 246.3 and 210.9 cm3 CH4/g SV, for the biomass: cellulose, maize silage, wheat straw and livestock excrement, respectively, and also by Almomani et al. (2020) with 297.99 cm3 CH4/g SV, in the AcoD of organic waste. The authors associate the experimental systems’ lower biomethane production with the variation in ambient temperature during the experiment, as the AD experiments were carried out in the exterior.
Experiment ii) which was characterised by the absence of a lag zone, had a faster start-up but obtained the lowest methane production limit.
The ER model is obtained based on the first order equation used to estimate biogas performance (Elagroudy et al., 2020). On the other hand, the CM demonstrated good performance for practical applications and fit in well with the experimental data (Nguyen, et al. 2020).
The logistical function corresponds with the overall form of biogas production kinetics that is an initial exponential increase and a final stabilisation at maximum production level (Li et al. 2012). The model considers that the biomethane production rate is proportional to the metabolic activity of the methanogenic consortium, represented by the quantity of methane already produced and the concentration of substrate. Likewise, the Gompertz model assumes that the gas production rate is proportional to the microbione activity, although the proportionality parameter decreases over time following first order kinetics, which can be attributed to the loss in efficiency of the fermentation rate over time (Altas, 2009).
The MR model is considered suitable for describing the methane production in the system. However, under the Akaike criteria, the ML model is better for our three experimental cases, as the differences shown by this statistical estimator show no impact from the adjustment (Table 5) and the accumulated prediction on day 70 (Table 4). The MR model having four parameters, one more than the ML model, is more flexible when faced with changes in pretreatment or control conditions of the experiment, and although the cost of numerical calculation is greater this becomes insignificant when compared to the advantages.
On comparing the predictions, the best qualified models proposed are ML and MR, with 3 or 4 adjustment parameters respectively, as their prediction differed from 1 to 1.5% from the experimental value (Table 4) and their adjustment, by determination coefficient “R2” and “RSS” showed less of a deviation with respect to the experimental values (Table 5).
The number of adjustment parameters and the use of special functions in the model, are often associated with a better description of the phenomenon, and relate directly to the need to rely on experimental data. It was shown that as the MR model has one more adjustment parameter, it has greater flexibility for more complex substrate degradation patterns with high fat contents (Tian et al. 2020).
Based on the experimental observations, it was shown that the approach of one model is not the only applicable approach, which has also been indicated by other authors (Ware et al. 2017, Pererva et al. 2020). The maximum Exponential Rise ER involved the lowest performance and is discarded as a prediction model, contrary to the proposal of Elagroudy et al. (2020).
4. Conclusions
The purpose of this research was the study of the kinetics of methane production from the AcoD of biomass residues. The mathematical modelling enabled the methane production phenomenon to be described for each of the cases under study. The following conclusions were drawn based on the analysis of the AcoD of waste from the meat and dairy industries and rural livestock systems, exposed to environmental conditions.
- Although the use of filtration systems is recommended for the correct use of biogas, subsequent studies are suggested to analyse methane production performance using hydrogen sulphide mitigation methodologies inside the reactor.
- The low performance in methane generation compared to that reported by other authors is attributed to the absence of heat treatment in the substrate, the exposure of the system to uncontrolled temperatures (outdoors) and the low thermal inertia of the system faced with temperature changes. These are aspects that must be considered for scaling.
It is concluded that when comparing the predictions, the best qualified models proposed to describe AD are ML and MR. The results of the study show the potential for promoting energy production with AD technology using the waste included in the analysed studies.
Acknowledgments
We gratefully acknowledge to Centro de Investigación en Materiales Avanzados S. C. (CIMAV); and Universidad La Salle de Chihuahua. As well as the projects: CONAHCYT-SENER 243715, CONAHCYT-SEMAR 305292 and CONAHCYT-CIENCIA DE FRONTERA 2023_G_1566 for their support to the generation of infrastructure and laboratories
References
Abouelenien, F., Fujiwara, W., Namba, Y., Kosseva, M., Nishio, N., & Nakashimada, Y. (2010). Improved methane fermentation of chicken manure via ammonia removal by biogas recycle. Bioresource technology. 101(16), 6368-6373. https://doi.org/10.1016/j.biortech.2010.03.071
Achinas, S., & Euverink, G. J. W. (2019). Effect of combined inoculation on biogas production from hardly degradable material. Energies, 12(2), 217. https://doi.org/10.3390/en12020217
Achmon, Y., Claypool, J. T., Pace, S., Simmons, B. A., Singer, S. W., & Simmons, C. W. (2019). Assessment of biogas production and microbial ecology in a high solid anaerobic digestion of major California food processing residues. Bioresource Technology Reports, 5, 1-11. https://doi.org/10.1016/j.biteb.2018.11.007
Aghdam, E. F., Scheutz, C., & Kjeldsen, P. (2017). Assessment of methane production from shredder waste in landfills: The influence of temperature, moisture and metals. Waste Management. 63, 226-237. https://doi.org/10.1016/j.wasman.2016.11.023
Akaike, H. (1974). A new look at the statistical model identification. IEEE transactions on automatic control, 19(6), 716-723. https://doi.org/10.1109/TAC.1974.1100705
Alkhrissat, T. (2024). The impact of organic loading on the anaerobic digestion of cow manure: Methane production and kinetic analysis. Case Studies in Chemical and Environmental Engineering, 9, 100589. https://doi.org/10.1016/j.cscee.2023.100589
Almomani, F., & Bhosale, R. (2020). Enhancing the production of biogas through anaerobic co-digestion of agricultural waste and chemical pre-treatments. Chemosphere. 126805. https://doi.org/10.1016/j.chemosphere.2020.126805
Altaş, L. (2009). Inhibitory effect of heavy metals on methane-producing anaerobic granular sludge. Journal of hazardous materials. 162(2-3), 1551-1556. https://doi.org/10.1016/j.jhazmat.2008.06.048
APHA, A. (1999). WEF-Method 2540 E—Fixed and volatile Solids lgnited at 550 C. Standard Methods for the examination of water and wastewater Washington.
Castrillón, L., Fernández-Nava, Y., Ormaechea, P., & Marañón, E. (2011). Optimization of biogas production from cattle manure by pre-treatment with ultrasound and co-digestion with crude glycerin. Bioresource technology. 102(17), 7845-7849. https://doi.org/10.1016/j.biortech.2011.05.047
Elagroudy, S., Radwan, A. G., Banadda, N., Mostafa, N. G., Owusu, P. A., & Janajreh, I. (2020). Mathematical models comparison of biogas production from anaerobic digestion of microwave pretreated mixed sludge. Renewable Energy. 155, 1009-1020. https://doi.org/10.1016/j.renene.2020.03.166
Hakimi, M., Manogaran, M. D., Shamsuddin, R., Johari, S. A. M., Hassan, M. A. M., & Soehartanto, T. (2023). Co-anaerobic digestion of sawdust and chicken manure with plant herbs: Biogas generation and kinetic study. Heliyon, 9(6). https://doi.org/10.1016/j.heliyon.2023.e17096
Imeni, S. M., Pelaz, L., Corchado-Lopo, C., Busquets, A. M., Ponsá, S., & Colón, J. (2019). Techno-economic assessment of anaerobic co-digestion of livestock manure and cheese whey (Cow, Goat & Sheep) at small to medium dairy farms. Bioresource technology. 291, 121872. https://doi.org/10.1016/j.biortech.2019.121872
Kasinath, A., Fudala-Ksiazek, S., Szopinska, M., Bylinski, H., Artichowicz, W., Remiszewska-Skwarek, A., & Luczkiewicz, A. (2021). Biomass in biogas production: Pretreatment and codigestion. Renewable and Sustainable Energy Reviews, 150, 111509. https://doi.org/10.1016/j.rser.2021.111509
Kehoe, S. I., Jayarao, B. M., & Heinrichs, A. J. (2007). A survey of bovine colostrum composition and colostrum management practices on Pennsylvania dairy farms. Journal of dairy science, 90(9), 4108-4116. https://doi.org/10.3168/jds.2007-0040
Kong, X., Xu, S., Liu, J., Li, H., Zhao, K., & He, L. (2016). Enhancing anaerobic digestion of high-pressure extruded food waste by inoculum optimization. Journal of environmental management. 166, 31-37. https://doi.org/10.1016/j.jenvman.2015.10.002
Li, L., Kong, X., Yang, F., Li, D., Yuan, Z., & Sun, Y. (2012). Biogas production potential and kinetics of microwave and conventional thermal pretreatment of grass. Applied biochemistry and biotechnology. 166(5), 1183-1191. https://doi.org/10.1007/s12010-011-9503-9
Li, W., Khalid, H., Amin, F. R., Zhang, H., Dai, Z., Chen, C., & Liu, G. (2020). Biomethane production characteristics, kinetic analysis, and energy potential of different paper wastes in anaerobic digestion. Renewable Energy. 157, 1081-1088. https://doi.org/10.1016/j.renene.2020.04.035
Li, Y.; Wang, Y.; Yu, Z.; Lu, J.; Li, D.; Wang, G.; Gong, X. (2018) Effect of inoculum and substrate/inoculum ratio on the performance and methanogenic archaeal community structure in solid-state anaerobic co-digestion of tomato residues with dairy manure and corn stover. Waste Manag. 81, 117–127. https://doi.org/10.1016/j.wasman.2018.09.042
Li, K., Liu, R., & Sun, C. (2015). Comparison of anaerobic digestion characteristics and kinetics of four livestock manures with different substrate concentrations. Bioresource technology, 198, 133-140. https://doi.org/10.1016/j.biortech.2015.08.151
López-Aguilar, H. A., Morales-Durán, B., Quiroz-Cardoza, D., & Pérez-Hernández, A. (2023). Lag phase in the anaerobic Co-digestion of Sargassum spp. and organic domestic waste. Energies, 16(14), 5462. https://doi.org/10.3390/en16145462
Moset, V., Al-zohairi, N., & Møller, H. B. (2015). The impact of inoculum source, inoculum to substrate ratio and sample preservation on methane potential from different substrates. Biomass and Bioenergy. 83, 474-482. https://doi.org/10.1016/j.biombioe.2015.10.018
Muthu, D., Venkatasubramanian, C., Ramakrishnan, K., & Sasidhar, J. (2017). Production of biogas from wastes blended with cowdung for electricity generation-a case study. In IOP Conf. Series, Earth Environ. Sci. 80(1). 012055. https://doi.org/10.1088/1755-1315/80/1/012055
Náthia-Neves, G., Berni, M., Dragone, G., Mussatto, S. I., & Forster-Carneiro, T. (2018). Anaerobic digestion process: technological aspects and recent developments. International Journal of Environmental Science and Technology. 15(9), 2033-2046. https://doi.org/10.1007/s13762-018-1682-2
Navarro, S. L. B., Lanuza, D. S. Z., Ramírez, J. C. A., & Calero, J. A. Z. (2014). Evaluación de la producción de biogás a partir de suero lácteo a escala de laboratorio. Revista Ciencia y Tecnología El Higo. 4(1), 29-35. https://doi.org/10.5377/elhigo.v4i1.8633
Nguyen, D. D., Jeon, B. H., Jeung, J. H., Rene, E. R., Banu, J. R., Ravindran, B., ... & Chang, S. W. (2019). Thermophilic anaerobic digestion of model organic wastes: Evaluation of biomethane production and multiple kinetic models analysis. Bioresource technology. 280, 269-276. https://doi.org/10.1016/j.biortech.2019.02.033
Nindhia, T. G. T., Surata, I. W., Nindhia, T. S., Negara, D. N. K. P., & Diantoro, M. (2017). Waste of Copper Alloy Chips as Biogas Desulfurizer. International Journal of Environmental Science and Development, 8(1), 15–18. https://doi.org/10.18178/ijesd.2017.8.1.913
Olawoye, B., & Gbadamosi, S. (2020). Digestion kinetics of native and modified cardaba banana starch: A biphasic approach. International Journal of Biological Macromolecules. https://doi.org/10.1016/j.ijbiomac.2020.03.089
Pečar, D., & Goršek, A. (2020). Kinetics of methane production during anaerobic digestion of chicken manure with sawdust and miscanthus. Biomass and Bioenergy. 143, 105820. https://doi.org/10.1016/j.biombioe.2020.105820
Pererva, Y., Miller, C. D., & Sims, R. C. (2020). Existing Empirical Kinetic Models in Biochemical Methane Potential (BMP) Testing, Their Selection and Numerical Solution. Water. 12(6), 1831. https://doi.org/10.3390/w12061831
Pitt RE, Cross TL, Pell AN, Schofield P, Doane PH. Use of in vitro gas production models in ruminal kinetics. Math Biosci 1999;159(2):145–63. http://dx.doi.org/10.1016/S0025-5564(99)00020-6
Roberts, S., Mathaka, N., Zeleke, M. A., & Nwaigwe, K. N. (2023). Comparative analysis of five kinetic models for prediction of methane yield. Journal of The Institution of Engineers (India): Series A, 104(2), 335-342. https://doi.org/10.1007/s40030-023-00715-y
Santos, A. D., Silva, J. R., Castro, L. M., & Quinta-Ferreira, R. M. (2022). Kinetic prediction of biochemical methane potential of pig slurry. Energy Reports, 8, 159-165. https://doi.org/10.1016/j.egyr.2022.01.128
Song, Y., Mahdy, A., Hou, Z., Lin, M., Stinner, W., Qiao, W., & Dong, R. (2020). Air Supplement as a Stimulation Approach for the in Situ Desulfurization and Methanization Enhancement of Anaerobic Digestion of Chicken Manure. Energy and Fuels, 34(10), 12606–12615. https://doi.org/10.1021/acs.energyfuels.0c01724
Tian, Y., Yang, K., Zheng, L. (2020) Modelling Biogas Production Kinetics of Various Heavy Metals Exposed Anaerobic Fermentation Process Using Sigmoidal Growth Functions. Waste Biomass Valor. 11, 4837–4848. https://doi.org/10.1007/s12649-019-00810-x
Ugwu, S. N., & Enweremadu, C. C. (2019). Effects of pre-treatments and co-digestion on biogas production from Okra waste. Journal of Renewable and Sustainable Energy, 11(1). https://doi.org/10.1063/1.5049530
Velázquez-Martí Borja, Meneses-Quelal Orlando W, Gaibor-Chavez Juan, Niño-Ruiz Zulay. (2019) Review of mathematical models for the anaerobic digestion process. Anaerob. Digest. 2019;1–20. http://dx.doi.org/10.5772/intechopen.80815
Ware, A., & Power, N. (2017). Modelling methane production kinetics of complex poultry slaughterhouse wastes using sigmoidal growth functions. Renewable Energy. 104, 50-59. https://doi.org/10.1016/j.renene.2016.11.045
Whiting, A., & Azapagic, A. (2014). Life cycle environmental impacts of generating electricity and heat from biogas produced by anaerobic digestion. Energy, 70, 181-193.
Yan, M., Fotidis, I. A., Tian, H., Khoshnevisan, B., Treu, L., Tsapekos, P., & Angelidaki, I. (2019). Acclimatization contributes to stable anaerobic digestion of organic fraction of municipal solid waste under extreme ammonia levels: focusing on microbial community dynamics. Bioresource technology, 286, 121376. https://doi.org/10.1016/j.biortech.2019.121376
Zhao, T., Chen, Y., Yu, Q., Shi, D., Chai, H., Li, L.,& He, Q. (2019). Enhancement of performance and stability of anaerobic co-digestion of waste activated sludge and kitchen waste by using bentonite. PloS one. 14(7), e0218856. https://doi.org/10.1371/journal.pone.0218856
Zwietering, M. H., Jongenburger, I., Rombouts, F. M., & Van’t Riet, K. J. A. E. M. (1990). Modeling of the bacterial growth curve. Applied and environmental microbiology. 56(6), 1875-1881.