Introduction
The development of wireless technology has increased rapidly due to its convenience and cost-effectiveness compared to wired applications, especially considering the advantages of network-based applications. This technology is used for the medical care of people and monitoring health variables from homes (Dey, Ashour, Shi, Fong, & Sherratt, 2017). Worldwide, life expectancy has increased thanks to advances in medicine; additionally, the birth rate has declined, resulting in an aging population that can burden countries economically. Therefore, developing cost-effective and easy-to-use systems to care for people’s health and well-being is essential (Talal, et al., 2019); these systems can contribute to improving care in health systems.
Mainly in Mexico and the United States, there are many people with obesity, affecting 39.8% of adults, contributing to numerous health problems, mainly generating cardiovascular diseases, hypertension, and type II diabetes, among others (Lum, et al., 2019). Moreover, in the last two decades, some diseases have wreaked havoc on the population in different countries, such as influenza and COVID-19. These diseases share common etiologies and occur in the same season; the latter semi-paralyzed the world for more than a year (Tang, et al., 2020). The most critical variables in these diseases to determine the health status of patients are temperature, percentage of oxygen, heart rate, and blood pressure. For these reasons, there is ample opportunity to develop instruments for measuring medical parameters at low cost and that integrate the necessary variables to determine the health status of people.
The control of healthy variables is vital to keep people salutary such as heart rate, body temperature, respiratory rate, blood oxygen saturation, heart rate variability, and blood pressure (Cheng, Wong, Chin, Chan, & So, 2018). The work proposed in (Perry, Sheehan, Thilaganathan, & Khalil, 2018) to measure Blood Pressure (BP) at home in pregnant women in which patients record their blood pressure using their smartphone notes. Meng and Chen created a BP sensor built with a self-propelled fabric to diagnose cardiovascular diseases using Bluetooth® technology (Meng, et al., 2018). Like Puput and Akio but with a program in Raspberry Pi Model 3, the sensor used was an MPS20N0040D-S Microelectromechanical Systems (MEMS) sensor (Prasetyo & Kitagawa, 2019).
There are commercial instruments on the web, such as the Samsung BioActive, a smartwatch that collects vital signs; its estimated market price is approximately 382 USD (Galaxy Watch4 Classic 42 mm Negro, 2022).
With the price of these auxiliary commercial instruments in treating or preventing some diseases, they are only available to a few. On the other hand, the proposed instrument in this paper measures more variables than all the previous ones. The instrument sends the variables to the cloud to be viewed from anywhere in the world with internet access. This meter is a great help to medical staff dealing with highly contagious and high-risk diseases.
The swift evolution of wireless technology, driven by its convenience and cost-effectiveness relative to wired applications, has significantly reshaped network-based applications, particularly in healthcare. This progress enables the remote monitoring of health variables from individuals’ homes (Dey, Ashour, Shi, Fong, & Sherratt, 2017). Globally, advancements in medicine have increased life expectancy while birth rates decline, contributing to an aging population that poses economic challenges for countries. Consequently, the imperative to develop cost-effective and user-friendly systems for maintaining people’s health and well-being has become paramount, enhancing overall healthcare systems (Talal, et al., 2019).
In both Mexico and the United States, a significant percentage of adults, approximately 39.8%, contend with obesity, contributing to various health issues, including cardiovascular diseases, hypertension, and type II diabetes (Lum, et al., 2019). Furthermore, the past two decades have witnessed the emergence of devastating diseases like influenza and COVID-19, sharing common etiologies and seasonal occurrences, with the latter significantly impacting global functioning for over a year (Tang, et al., 2020). Critical variables in assessing the health status of patients affected by these diseases include temperature, oxygen saturation, heart rate, and blood pressure. This provides ample opportunity to develop cost-effective instruments to measure these medical parameters and integrate essential variables for a comprehensive health assessment.
Monitoring key health variables, such as heart rate, body temperature, respiratory rate, blood oxygen saturation, heart rate variability, and blood pressure, is indispensable for maintaining individuals’ well-being (Cheng, Wong, Chin, Chan, & So, 2018). Previous work (Perry, Sheehan, Thilaganathan, & Khalil, 2018) proposed a method for measuring Blood Pressure (BP) at home, where pregnant women recorded their blood pressure using smartphone notes. Meng and Chen introduced a BP sensor employing self-propelled fabric and Bluetooth® technology for diagnosing cardiovascular diseases (Meng, et al., 2018). Similarly, Puput and Akio, utilizing a program in Raspberry Pi Model 3, employed an MPS20N0040D-S Microelectromechanical Systems (MEMS) sensor for the same purpose (Prasetyo & Kitagawa, 2019).
While commercial instruments, such as the Samsung BioActive smartwatch, priced at approximately 382 USD, are available online and collect vital signs (Galaxy Watch4 Classic 42 mm Negro, 2022), their accessibility is limited due to their cost. In contrast, the proposed instrument in this paper surpasses its counterparts by measuring a more comprehensive set of variables. Additionally, it transmits these variables to the cloud for remote accessibility worldwide, proving invaluable for medical personnel dealing with highly contagious and high-risk diseases.
1. Related Work
Although several papers are related to remote health, most only measure two variables. Researchers in (Al khafajiy, et al., 2019) developed a prototype using the data sent to the cloud to detect any disorders in the patient and inform the doctors about any abnormalities remotely in real-time. The measurement of the signs of respiration and heart rate through radar was conducted in a non-invasive way considering the variables of respiration and heart rate (Khan & Cho, 2017; Wu, Wu, & Yuce, 2018).
Shahidul proposed an Arduino-based four-variable (Body temperature, pulse rate, Oxygen saturation, and heart pressure) prototype (Islam, et al., 2019); it was made with an IoT-Particle Photon board, and its platform for data monitoring and user interface, similar to the one presented in (Jamil, Ahmad, Iqbal, & *, 2020). However, our approach with Particle Photon uses existing sensors to make the measurements and calculates blood pressure using an algorithm.
An intelligent meter was developed with Bluetooth Low Energy (BLE) sensors in the literature (Alfian, et al., 2018). A paper presented the development of Smart Wearable Sensors (SWS) for real-time health monitoring via Bluetooth. This sensor is specifically designed to monitor sleep status, although sleep status can alter several health variables, it does not consider measuring any other variables. (Ruonan, et al., 2021).
Alizadeh, and Shaker used a Frequency-Modulated Continuous Wave (FMCW) radar operating at 77 GHz in a bedroom setting to extract respiration and heart rate from a patient confined to bed (Alizadeh, Shaker, Martins de Almeida, Morita, & Safavi-Naeini, 2019). This work measures only two vital parameters and does not present remote communication to view the variables.
With the beginning of the COVID-19 pandemic, social distancing was commonplace. IoT health monitoring systems reduced frequent visits between patients and doctors. For these reasons, a paper was presented to control a person’s blood pressure, heart rate, oxygen level, and temperature through IoT and a Raspberry (Bhardwaj, Joshi, & Gaur, 2022); it uses a Raspberry PI, which needs to have a local server installed for cloud connection. With a Particle Photon, this setup is not required because it has a cloud platform, which allows it to always be connected. A device designed to monitor multiple vital parameters is presented in (Randazzo, Ferretti, & Pasero, 2020) with a mobile application to track the patient’s electrocardiogram, SpO2, temperature, and physical activity integrating communication by Bluetooth. Considering Bluetooth’s short range compared to Wi-Fi, it already has a significant disadvantage when the least possible contact between medical personnel and the patient is required in the face of a highly contagious and high-risk disease. The design of a real-time health monitoring system to measure pressure and heart rate with data storage capability, health personnel can access the data via GSM (Global System for Mobile communication) over the web (Swaroop, Chandu, Gorrepotu, & Deb, 2019). In Haghi (2020) the authors developed a bracelet to measure environmental parameters and vital signs with IoT technology; the prototype includes real-time communication between users and a doctor, measuring respiratory rate, heart rate, temperature, and environmental parameters.
A prototype designed in Misbahuddin, Zubairi, Alahdal, & Malik (2018) monitors patients in ambulances when transferred to the hospital, measuring heart rate, blood oxygen, airflow, body temperature, ECG, glucometer, blood pressure, and patient position. To achieve the monitoring, the Arduino UNO was used, and the ESP8286 was added for Wi-Fi connectivity to send the data to the hospital server.
The proposed a single input, single output (SISO) frequency-modulated continuous wave (FMCW) radar architecture was presented in Mercuri, et al. (2021). The radar sensor integrates two scanning antennas to distinguish people from objects to retrieve their respiratory and heart rate information. However, the proposed device in this paper contemplates more parameters and the option of obtaining the value of vital signs through the Internet, allowing medical personnel to spend most of the time without contact with the patient. A patient-centric approach is essential, and the IoT paradigm will continue to generate increasingly efficient solutions for patient management in hospitals and home care.
For a better understanding of the comparison of the devices, Table 1 summarizes the vital parameters that each of them measures and the technology for its operation.
Table 1
Comparison of vital parameters and the technology.
|
Ref. |
Heart |
Breathing freq. |
Blood oxygenation |
Body temp. |
Diastolic |
Arduino |
Raspberry |
Mc |
Mp |
|
(Khan & Cho, 2017) |
X |
X |
|
|
|
|
|
|
Radio |
|
(Wu, Wu, & Yuce, 2018) |
X |
|
|
X |
|
|
Wi-Fi |
|
|
|
(Islam, et al., 2019) |
X |
|
X |
X |
|
BT |
|
|
|
|
(Jamil, Ahmad, Iqbal, & *, 2020) |
|
X |
X |
X |
|
|
Wi-Fi |
|
|
|
(Alfian, et al., 2018) |
X |
|
|
|
X |
|
|
|
BT |
|
(Alizadeh, Shaker, Martins de Almeida, Morita, & Safavi-Naeini, 2019) |
X |
X |
|
|
|
|
|
|
Radio |
|
(Bhardwaj, Joshi, & Gaur, 2022) |
X |
|
X |
X |
X |
|
Wi-Fi |
|
|
|
(Randazzo, Ferretti, & Pasero, 2020) |
|
|
X |
X |
|
|
|
BT |
|
|
(Swaroop, Chandu, Gorrepotu, & Deb, 2019) |
X |
X |
Wi-Fi |
||||||
|
(Haghi, 2020) |
X |
X |
|
X |
|
|
|
|
Wi-Fi |
|
(Misbahuddin, Zubairi, Alahdal, & Malik, 2018) |
X |
X |
X |
X |
BT |
Wi-Fi |
|||
|
(Mercuri, et al., 2021) |
X |
X |
|
|
|
|
Radio |
||
|
Proposed device |
X |
|
X |
X |
X |
|
|
Wi-Fi |
|
Table 1 presents an overview of various technologies employed for connectivity, the devices utilized in the development process, and the variables taken into account by each study for health monitoring and measurement. Among the reviewed approaches, Wi-Fi-based solutions demonstrate superior reach and prove more advantageous for remote health monitoring. Additionally, devices featuring a server within their platform exhibit a notable advantage by reducing dependency on local servers. Lastly, the capability to measure a comprehensive array of vital signs further underscores the efficacy of these technologies.
Due to the above analysis, the need to make a low-cost device with several variables that would allow the integration of new medical parameters was visualized; in addition, considering that the world was in the final stage of a pandemic with a large number of deaths of civilians and medical personnel, which led to the development of a vital signs meter with Wi-Fi connection, which would reduce the risk to health personnel. On the other hand, seeing the saturation of hospitals in our environment, it was necessary to make a device that would help monitor vital signs by doctors at home.
Something essential was to design and build a device with commercial electronic devices available in the market and of easy acquisition; that would allow integration variables easily without representing very high costs.
Our proposal is a device that performs vital signs monitoring through non-invasive sensors using the Internet of Things, which allows the medical or nursing staff to have a simplified view of the patient’s condition, with constant monitoring of the person, obtaining vital data at any time of the day and from any place with Internet access, the instrument can also help medical staff outside the hospital monitor treatments at home after patients leave the hospital.
The device is free software; therefore, it can easily integrate more variables; the application is for local and remote monitoring in real time; it is built with commercial electronic devices; in addition, so it is easy to reproduce and essential for several highly infectious and life-threatening diseases in humans.
The proposed device is distinguished by its accessibility, versatility, and potential usefulness in highly infectious and life-threatening diseases. In addition, there is the possibility of decreasing hospital patient costs due to reduced time or hospital stays.
2. Materials and Methods
2.1. Prototype Development
The methodology in the design of the system is to divide the work of the sensors and connect them to the system’s prototype.
The Particle’s Photon card provides the wireless communication system, and the board uses a Broadcom Wi-Fi BCM43362 chip and data transformation by STM32 ARM Cortex M3 microcontroller. Another hardware resource is 128kB of RAM.
The creation of the device was carried out so that the variables of body temperature, heart rate, and oxygenation in the blood can be observed on a computer and an intelligent cell phone.
The system comprises two analog/digital sensors integrated into the Wi-Fi module for this prototype. The first is the MAX30100 pulse oximetry sensor, which works as a method of detecting heart rate and blood oxygenation (SpO_2) by emitting two types of light, red and infrared, as well as the MLX90614 module, which is a temperature sensor. The sensor becomes sensitive to infrared light radiation emitted by a body at a distance.
These sensors were selected because they are non-invasive, so no incisive or surgical method is required for them to be used. The communication that both sensors share is through the I2C serial protocol. They are also low cost and can be easily found in the market. In addition, they are also compatible with Particle Photon.
Therefore, as mentioned above, the sensor reading is given through the STM32F205RGY6 microcontroller and I2C communication lines.
The MAX30100 module integrates the actions of a pulse oximeter and a heart rate monitor. This optical sensor obtains readings using two LED wavelengths, one red and the other infrared, to measure the absorbance of the blood pulse through a photodetector. Usually, the LED color scheme is optimized for reading data taken by the index finger.
This sensor consists of an ambient light cancellation method, a 16-bit sigma/delta ADC, and a discrete time filter. Its operating range is from 1.1 to 3.3 V. It maintains an I2C interface plus an INT pin. A high signal-to-noise ratio (HSNR) provides strong resistance to motion artifacts while maintaining fast data throughput.
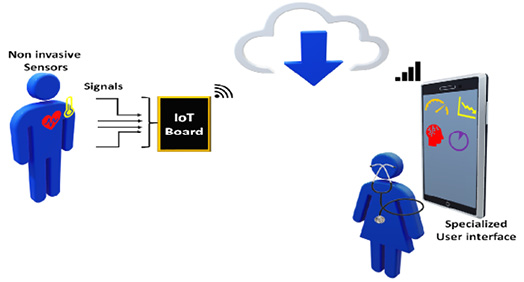
The communication protocol for the Particle Photon card and the analog sensors is through IPv4, which uses 32-bit addresses. It is compatible with the Wi-Fi standard B, G, and N working at a frequency of 120 Mhz. Figure 1 shows the communication diagram between the sensors, the internet, and the communication card.
Figure 1
General diagram of the communication system.
Note. Own elaboration.
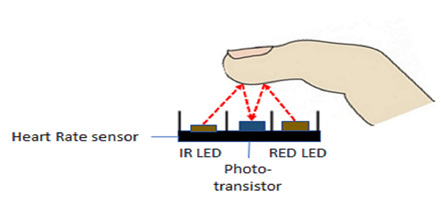
Figure 2 shows a Diagram for heart rate measurement. In this process, IoT transmits information through an internet network. Once the sensor readings are given, data is processed and sent through a wireless access point within the server for later said information to be translated and displayed in real-time to the cloud server.
Figure 2
Diagram for heart rate measurement.
Note. Own elaboration.
2.2. Process of obtaining data provided by the sensor.
In research, it is defined as the maximum heart rate value that can be achieved and can be determined by a maximum effort test in the laboratory or by theoretical references based on the constant of 220 BPM (beats per minute) and age; or also with 208 - 0.7 × age (Sarzynski, et al., 2013):
|
maximum heart rate = 220 - user age |
|
maximum heart rate = 208 -0.7 x user age |
The way to get information from the sensor is to adjust it to the point where the heart rate is taken without causing discomfort to the patient.
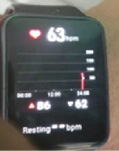
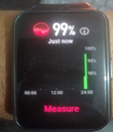
Data collection occurs through a wireless connection. Table 2 shows the Particle Photon virtual console, which shows the heart rate and blood oxygenation (SpO2) data and the sensor’s validation compared with a SmartWatch that is available on the market.
Table 2
Validation of data provided by the sensor.
|
Data source |
Heart Rate (BPM) |
Blood oxygenation SpO2 (%) |
|
Data delivered by Particle Console |
BPM 63.8 |
Spo2 98.4 |
|
Validation using a Smart-Watch |
|
|
The sensor can support two sequential processing communication channels (red and infrared); applying the Beer-Ambert Law, it is possible to define the intensity of light, which manages to decrease with the length of the trajectory starting from the point of light emitted through the finger. We have that there is a current component direct and an alternating current component, so the percentage of oxygenation in the blood (SpO2) is given by the expression of equation 3.
|
$$ R'=\frac{\mathrm{log}_{10}(I_{ac})(\lambda _1)}{\mathrm{log}_{10}(I_{ac})(\lambda _2)} $$ |
Where Iac is defined as the intensity of light used in the wavelengths. λ1 and λ2 are the wavelengths.
2.3. MLX90614 infrared body temperature sensor
The MLX90614 Infrared Temperature Sensor is a non-contact temperature sensor. It is used to measure a patient’s temperature and does not require direct contact. One only must point the sensor toward the object to measure the temperature (Subandi, Budi Nugroho, Nurkamilia, & Akhrian, 2021).
The value registered by the sensor corresponds to the patient’s average temperature within the sensor’s measurement field. This sensor offers an accuracy of 0.5 °C.
Its operating principle is based on the Stefan-Boltzmann principle, which determines that any object or body above absolute zero (0 °C) emits infrared radiation (Reggiani & Alfinito, 2021). The radiation emitted is proportional to the patient’s temperature; this way, the net radiation emitted can be known from the sensor generated voltage.
The calibrated emission factor is determined in equation 4:
|
$$ q=\varepsilon _1*a_1*T^4_1*\sigma *A_{1}*F_{a-b}-\varepsilon _{2}*T_{2}^{4}*\sigma *A_{2} $$ |
Where each of the literals is defined as:
$\varepsilon _{1} $and $\varepsilon _{2} $correspond to the emissivity of the patient and the environment.
$a_{1}$ is the absorbance of the sensor.
$\sigma $ corresponds to the Stefan-Boltzmann constant.
$ F_{a-b}$ is the shading factor.
$T_{1}$ and $T_{2}$ are the known temperatures of the sensor and the required temperature, respectively.
This sensor can detect radiation and convert it into a temperature. So, the infrared thermometer calculates the difference between the IR radiation emitted by the patient and the environment.
3. Experimental Results and Discussion
The temperature should be taken at approximately 4-10 cm. The measurement must be made with the sensor positioned towards the palmar muscle of the arm or the patient’s forehead and parallel to surfaces to obtain a more accurate incident radiation reading.
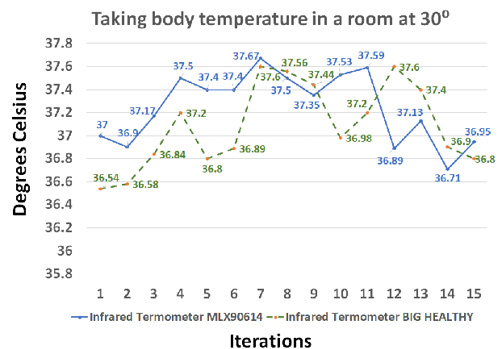
Figure 3 shows the results obtained in measuring body temperature, taking 15 samples from a single patient in a room at room temperature. Samples were taken from the patient’s forehead.
Figure 3
Taking body temperature with the BIG HEALTHY thermometer and the proposed device.
Note. Own elaboration.
The graph in figure 3 compares the vital sign taking between the MLX90614 temperature sensor and a digital infrared thermometer of the BIG HEALTHY® brand. The temperature ranges remain within the characteristics of the sensor.
3.1. Diastolic blood pressure approximation
In diastolic blood pressure checking, there is a related method by multiple devices that determine the blood pressure index of any patient. Said method maintains the census of the emission of electrocardiographic R waves, which detects the pulse of the blood consequent to a blood vessel and determines the time lapses TT between the emission of each R wave.
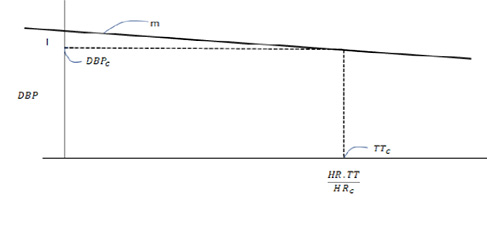
Figure 6 shows the graph determining the linear variations of the Diastolic Arterial Pressure (DAP).
Measuring diastolic blood pressure can help prevent adverse cardiovascular events (such as the J-curve phenomenon) (Li, et al., 2021).
The method of approximation in the blood pressure index determines diastolic blood pressure control; this does not remain unchanged, even if the patient is exercising or un-der stress, which makes it more feasible to obtain an approximation based on equation 5.
|
$$ DBP=m*TT*(HR/HR_{c})+I $$ |
- $DBP$ is diastolic blood pressure.
- $m$ corresponds to the adjustment factor in the gradient of figure 6 for the adjustment of the graph in a straight line in the variation of absolute diastolic arterial pressure that corresponds to the ordinate concerning the relation $(HR/HR_{c})$ that corresponds to the abscissa which maintains a value of -0.06 $(HR/HR_{c})$.
- $TT$ corresponds to the time from when the heartbeat begins until said activity ends to give way to the time of the next heartbeat.
- $I$ is the intersection shown in Figure 4. It is the slope m of the line with said ordinate.
- $HR_c$ corresponds to a constant equivalent to a resting heart rate value.
Figure 4
Linear variations of DBP under the equation (HR.TT)/HRc.
Note. Own elaboration.
3.2. Blood pressure measurement
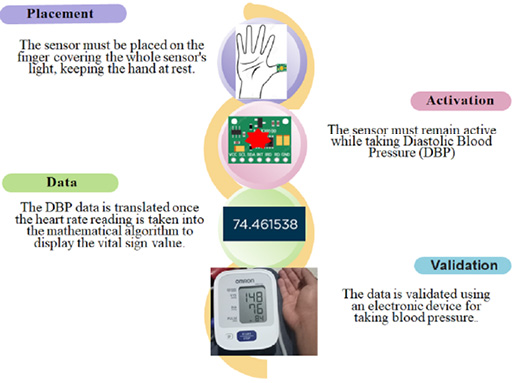
A heart rate detection algorithm can determine diastolic blood pressure. Figure 5 shows how diastolic blood pressure can be measured.
Figure 5
Process of measurement Diastolic Blood Pressure.
Note. Own elaboration.
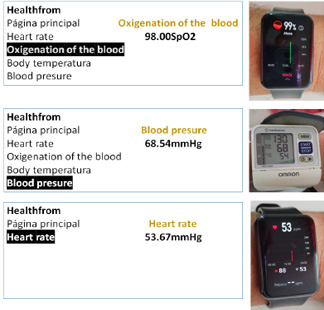
Figure 6 compares commercial medical instruments against the proposed device in the variables of oxygen percentage, diastolic pressure, and beats per minute.
Figure 6
Proposed instrument vs. commercials.
3.3. Obtaining vital signs data.
The noteworthy aspects of the utilization of the noninvasive monitoring system for acquiring vital signs encompass the following:
- Implementation of I2C Communication Sensors: A pivotal element is the incorporation of I2C communication sensors into the monitoring system. This strategic choice facilitates seamless sensor data exchange, ensuring precise and efficient monitoring of vital signs.
- Communication Methodology Design: The design of the communication methodology between the vital sign sensors and the Photon card stands out. It involves the integration of computer additives, leveraging the Particle IDE programming platform. This robust framework enhances the interoperability and functionality of the monitoring system.
- Interactive Web Interface Design: A significant contribution lies in creating an interactive web interface that vividly displays vital signs in real time. This interface, crafted using HTML, CSS, and JS programming languages, provides a user-friendly platform for monitoring comprehensive and dynamic vital signs.
- Validation Against Market-available Equipment: The validation process is crucial, ensuring the reliability and accuracy of vital signs obtained by the prototype. Comparative assessments against commercially available vital signs monitoring equipment contribute to the credibility of the noninvasive monitoring system.
In summary, the integration of I2C communication sensors, the meticulous design of communication methodologies, the creation of an interactive web interface, and the thorough validation process collectively underscore the efficacy and innovation of the noninvasive monitoring system for acquiring vital signs. It is essential to emphasize the need for the patient to rest when measuring all vital signs.
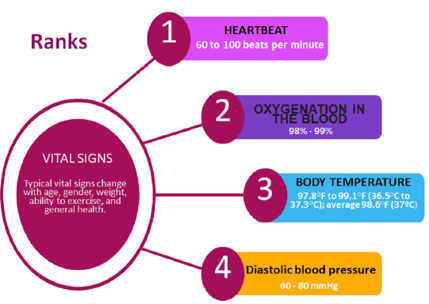
Figure 7 shows the vital signs parameters according to the NOM-035-SSA3-2012 standard.
Figure 7
Vital signs parameters according to the NOM-035-SSA3-2012 standard.
Note. Own elaboration.
Table 4 shows an evaluation of nine patients taking their vital signs and comparing the results delivered on the web interface with the devices available on the market.
The sample was taken from nine people aged between 22 and 42. Considering two of the following criteria:
- The patient shows no history of cardiovascular problems.
- Patients with cardiovascular problems or a history of these.
It is essential to define the parameters in which the patients are. Measurements should be taken while at rest, as these reflect health status without any other effects.
The maximum relative errors were 1.02 in oxygen percentage, 5 in heart rate, 1.9 in temperature, and 10.81 in blood pressure. Although compared to commercial instruments, they were only factory certified.
The values of the commercial instruments are those in bold type.
Table 4
Evaluation of nine patients taking their vital signs.
|
PATIENT |
AGE |
OXYGENATION (%) |
HEART PULSE |
TEMPERATURE (°C) |
PRESSURE (mmHg) |
||||
|
1 |
22 |
99 |
98 |
85 |
86 |
36.8 |
36.4 |
82 |
87 |
|
2 |
28 |
99 |
99 |
75 |
73 |
37.3 |
37.8 |
79 |
75 |
|
3 |
30 |
98 |
99 |
80 |
84 |
37.5 |
36.8 |
76 |
68 |
|
4 |
22 |
99 |
99 |
67 |
67 |
37.1 |
37.6 |
84 |
83 |
|
5 |
31 |
97 |
98 |
62 |
68 |
37.7 |
36.4 |
81 |
74 |
|
6 |
27 |
98 |
99 |
58 |
60 |
36.8 |
37.5 |
86 |
80 |
|
7 |
28 |
99 |
99 |
84 |
84 |
37.7 |
37.7 |
85 |
76 |
|
8 |
36 |
99 |
99 |
78 |
75 |
36.5 |
36.5 |
74 |
83 |
|
9 |
42 |
99 |
99 |
65 |
64 |
36.4 |
36.8 |
75 |
73 |
Figure 8 shows the image of the user’s web interface, which can be accessed through the following address: https://sites.google.com/view/healthfrome/p%C3%A1gina-principal?authuser=1.
Figure 8
Web user interface.

Note. Own elaboration.
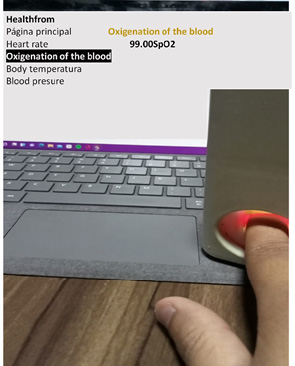
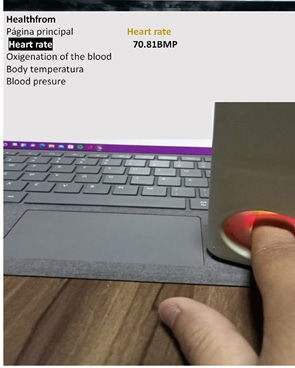
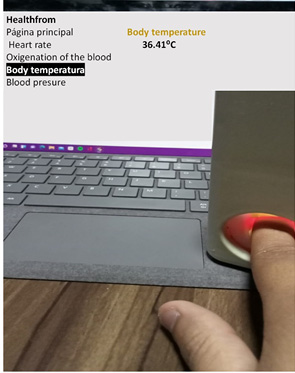
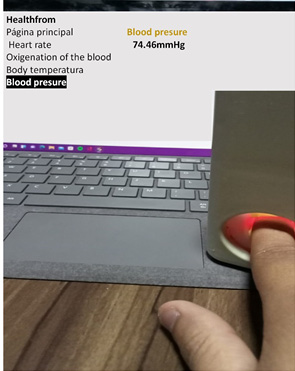
Figure 9 shows images of the use of the prototype for measuring the medical variables of oxygen percentage, pressure, heart rate, and temperature. For each variable, the measurement in a person and the corresponding visualization in the web user interface is shown. The photograph is shown in the same physical place; however, it can be seen anywhere in the world with the website address.
Figure 9
The use of the prototype.
|
|
4 |
|
|
|
Note. Own elaboration.
4. Conclusions
This study introduces an Internet of Things (IoT) application designed for real-time local and remote monitoring of vital signs crucial for maintaining optimal health. Comparative analysis with commercially available meters yielded results demonstrating comparable and acceptable measurements. A notable feature of this vital signs monitor is its construction using readily available commercial electronic devices, enhancing accessibility. Furthermore, its reproducibility is simplified and designed with elements tailored for seamless integration into the IoT landscape. The primary objective of this monitor is to facilitate remote medical monitoring of vital signs, particularly vital in the context of various highly infectious and life-threatening human diseases. While the design is straightforward, it effectively fulfills its intended purpose.
Diverging from most smartwatches that connect to mobile applications, this prototype offers a unique advantage. It measures a broader range of variables, including blood pressure, heart rate, temperature, and oxygen percentage, and it also allows multiple individuals to access data from any part of the world through a simple connection link. An essential contribution of this device lies in its ability to measure a comprehensive set of variables, addressing a gap in conventional medical instruments that often measure fewer variables and are confined to local use.
Moreover, the device could aid medical professionals in detecting diseases such as COVID-19, influenza, and cardiovascular and pulmonary conditions, leveraging the variables measured by the proposed instrument. This capability significantly reduces the need to expose healthcare workers to potential risks in hospital settings frequently.
Finally, shortly, the work will be extended to incorporate more variables.
Acknowledgments
The University of Colima for facilitating the necessary conditions for the research of students and professors. Also, to CONACYT for supporting the investigators of the SNI in Mexico. Francisco Javier Jaime Marín for his help in the translation review. Daniel Alfonso Verde Romero for his support in the IoT training.
References
Al khafajiy, M., Baker, T., Chalmers, C., Asim, M., Kolivand, H., Fahim, M., & Waraich, A. (2019). Remote health monitoring of elderly through wearable sensors. Multimed Tools Appl, 78(17), 24681-2470. https://doi.org/10.1007/s11042-018-7134-7
Alfian, G., Syafrudin, M., Ijaz, M. F., Syaekhoni, M. A., Fitriyani, N. L., & Rhee, J. (2018). A personalized healthcare monitoring system for diabetic patients by utilizing BLE-based sensors and real-time data processing. Sensors, 18(3), 2183. https://doi.org/10.3390/s18072183
Alizadeh, M., Shaker, G., Martins de Almeida, J. C., Morita, P. P., & Safavi-Naeini, S. (2019). Remote Monitoring of Human Vital Signs Using mm-Wave FMCW Radar. IEEE Access, 7(1), 54958-54968. https://doi.org/10.1109/ACCESS.2019.2912956
Bhardwaj, V., Joshi, R., & Gaur, A. M. (2022). IoTBased Smart Health Monitoring System for COVID19. SN Computer Science, 3(2), 1-11. https://doi.org/10.1007/s42979-022-01015-1
Cheng, C. H., Wong, K. L., Chin, J. W., Chan, T. T., & So, R. H. (2018). Deep Learning Methods for Remote Heart Rate Measurement: A Review and Future Research Agenda. Sensors, 21(18), 6296. https://doi.org/10.3390/s21186296
Dey, N., Ashour, A. S., Shi, F., Fong, S. J., & Sherratt, R. S. (2017). Developing Residential Wireless Sensor Networks for ECG Healthcare Monitoring. IEEE Transactions on Consumer Electronics, 63(4), 442-449. https://doi.org/10.1109/TCE.2017.015063
Galaxy Watch4 Classic 42 mm Negro. (2022). (SAMSUNG) Retrieved marzo 13, 2022, from https://www.samsungstore.mx/galaxy-watch4-42mm/p?gclid=CjwKCAiA4KaRBhBdEiwAZi1zzgRxXd7y_9bQqlVMpV1THO2ev5cW57badCFaSFbg34RyOxqhoC5QUQAvD_BwE
Haghi, M. (2020). A Flexible and Pervasive IoT-Based Healthcare Platform for Physiological and Environmental Parameters Monitoring. EEE Internet of Things Journal, 7(6), 5628-5647. https://doi.org/10.1109/JIOT.2020.2980432
Islam, M. S., Islam, M. T., Almutairi, A. F., Beng, G. K., Misran, N., & Amin, N. (2019). Monitoring of the human body signal through the Internet of Things (IoT) based LoRa wireless network system. Applied Sciences, 9(9), 1884. https://doi.org/10.3390/app9091884
Jamil, F., Ahmad, S., Iqbal, N., & *, D.-H. K. (2020). Towards a remote monitoring of patient vital signs based on IoT-based blockchain integrity management platforms in smart hospitals. Sensors, 20(8), 2195. https://doi.org/10.3390/s20082195
Khan, F., & Cho, S. H. (2017). A detailed algorithm for vital sign monitoring of a stationary/non-stationary human through IR-UWB radar. Sensors, 17(2), 290. https://doi.org/10.3390/s17020290
Li, J., Somers, V. K., Gao, X., Chen, Z., Ju, ;., Lin, Q., . . . Zhang, L. (2021). Evaluation of optimal diastolic blood pressure range among adults with treated systolic blood pressure less than 130 mm Hg. JAMA network open, IV(2), e2037554-e2037554. https://doi.org/10.1001/jamanetworkopen.2020.37554
Lum, T., Connolly, M., Marx, A., Beidler, J., Hooshmand, S., Kern, M., . . . Hong, M. Y. (2019). Effects of Fresh Watermelon Consumption on the Acute Satiety Response and Cardiometabolic Risk Factors in Overweight and Obese Adults. Nutrients, 11(3), 595. https://doi.org/10.3390/nu11030595
Meng, K., Chen, J., Li, X., Wu, Y., Fan, W., Zhou, Z., . . . Wang., Z. L. (2018). Flexible Weaving Constructed Self-Powered Pressure Sensor Enabling Continuous Diagnosis of Cardiovascular Disease and Measurement of Cuffless Blood Pressure. Advanced Functional Materials, XXlX(5). https://doi.org/10.1002/adfm.201806388
Mercuri, M., Hornung, R., Zhang, P., Visser, H., Hijdra, M., Liu, Y. H., . . . Torfs, T. (2021). 2-D Localization, Angular Separation and Vital Signs Monitoring Using a SISO FMCW Radar for Smart Long-Term Health Monitoring Environments. IEEE Internet of Things Journal, 8(14), 11065-11077. https://doi.org/10.1109/JIOT.2021.3051580
Misbahuddin, S., Zubairi, J. A., Alahdal, A. R., & Malik, M. A. (2018). IoT-Based Ambulatory Vital Signs Data Transfer System. Journal of Computer Networks and Communications, 2018(1), 1-8. https://doi.org/10.1155/2018/4071474
Perry, H., Sheehan, E., Thilaganathan, B., & Khalil, A. (2018). Home blood-pressure monitoring in a hypertensive pregnant population. Ultrasound in Obstetrics & Gynecology, 51(4), 524-530. https://doi.org/10.1002/uog.19023
Prasetyo, P., & Kitagawa, A. (2019). ZigBee Radio Frequency (RF) Performance on Raspberry Pi 3 for Internet of Things (IoT) based Blood Pressure Sensors Monitoring. International Journal of Advanced Computer Science and Applications(IJACSA), X(5). https://doi.org/10.14569/IJACSA.2019.0100504
Randazzo, V., Ferretti, J., & Pasero, E. (2020). A Wearable Smart Device to Monitor Multiple Vital Parameters—VITAL ECG. Electronics, 9(2), 300. https://doi.org/10.3390/electronics9020300
Reggiani, L., & Alfinito, E. (2021). Stefan-Boltzmann law revisited. Quantitative InfraRed Thermography Journal, XVIII(4), 269-282. https://doi.org/10.48550/arXiv.2112.12090
Ruonan, L., Xuelian, W., Jiahui, X., Junhuan, C., Bin, L., Zhiyi, W., & Lin, W. Z. (2021). Smart wearable sensors based on triboelectric nanogenerator for personal healthcare monitoring. Micromachines, 12(4), 352. https://doi.org/10.3390/mi12040352
Sarzynski, M. A., Rankinen, T., Earnest, C. P., Leon, A. S., Rao, D. C., Skinner, J. S., & Bouchard, C. (2013). Measured Maximal Heart Rates Compared to Commonly Used Age-Based Prediction Equations in the Heritage Family Study. American Journal of Human Biology, 25(5), 695-701. https://doi.org/10.1002/ajhb.22431
Subandi, Budi Nugroho, A. S., Nurkamilia, & Akhrian, S. A. (2021). Body Temperature Measurement Tool for Early Detection of COVID-19 Based on Interactive Argumented Reality Technology and Sensor MLX90614: Framework and Prototyping. JURIKOM (Jurnal Riset Komputer), VIII(5), 141-148. http://dx.doi.org/10.30865/jurikom.v8i5.3622
Swaroop, K. N., Chandu, K., Gorrepotu, R., & Deb, S. (2019). A health monitoring system for vital signs using IoT. Internet of Things, 5(1), 116-129. https://doi.org/10.1016/j.iot.2019.01.004
Talal, M., Zaidan, A. A., Albahri, A. S., Alamoodi, A. H., Albahri, O. S., Alsalem, M. A., . . . Mohammed, K. I. (2019). Smart Home-based IoT for Real-time and Secure Remote Health Monitoring of Triage and Priority System using Body Sensors: Multi-driven Systematic Review. Journal of medical systems, 43(3), 1-34. https://doi.org/10.1007/s10916-019-1158-z
Tang, X., Du, R. H., Wang, R., Cao, T. Z., Guan, L. L., & Yang, C. Q. (2020). Comparison of hospitalized patients with ARDS caused by COVID-19 and H1N1. Chest, 158(1), 195-205. https://doi.org/10.1016/j.chest.2020.03.032
Wu, F., Wu, T., & Yuce, M. R. (2018). An internet-of-things (IoT) network system for connected safety and health monitoring applications. Sensors, 19(1), 21. https://doi.org/10.3390/s19010021
