Introduction
Tourism is one of the fastest growing economic sectors worldwide, which had recorded eight years of consecutive growth (CNET (Consejo Nacional Empresarial Turístico), 2018). In the case of Mexico, 39.3 million international tourists were received in 2017, placing it in sixth place among the 10 main tourist destinations worldwide (OMT (Organización Mundial del Turismo), 2018). Demand for nature-based tourism keeps increasing and visitors are willing to pay a higher cost from 2-40% for receiving environmentally-friendly services (Balmford et al., 2009; UNWTO (United Nations Environment Programme and World Tourism Organization), 2012; Winter et al., 2020). Protected areas (PA) are the main destinations for this type of tourism (CONANP (Comisión Nacional de Áreas Naturales Protegidas) & SEMARNAT (Secretaría del Medio Ambiente y Recursos Naturales), 2007; Eagles, 2014; R. M. Ibáñez Pérez, 2014)el estudio, discusión e investigación del fenómeno turístico y recreativo en las Áreas Protegidas ha ido acrecentándose también en foros y organismos internacionales. Actualmente esta clase de turismo ha sido reconocido en diversas convenciones y declaraciones como una oportunidad de desarrollo sustentable. Sin embargo esta actividad puede amenazar al patrimonio natural y al cultural, pues se han registrado experiencias internacionales que demuestran que ésta causa impactos negativos en el contexto natural, social e incluso económico de las Áreas Protegidas –por la infraestructura y los proyectos turísticos no planificados, o por visitaciones no reguladas ni programadas. Este crecimiento en visitación, así como el interés por manejarlo apropiadamente, es un fenómeno que también se replica en México dentro de las Áreas Protegidas Federales (APF. According to Balmford et al. (2015), terrestrial PA worldwide had received 8 billion visits per year and Mexico received 2.8 million tourists in terrestrial and aquatic PA in 2017 (CONANP 2018).
Appropriate management and nature-based tourism in a PA could be considered driving factors for the destination sustainable development (Dwyer & Edwards, 2000; Kim et al., 2019; Siikamäki et al., 2015; Snyman & Bricker, 2019). However, tourism poses also potential threats to the environment and host population, such as air and water pollution, habitat fragmentation, alterations in wildlife behavior and physiology, congestion, crime and changes in the host community culture (Almeida García et al., 2015; Andereck et al., 2005; Buckley, 2011; Eagles et al., 2002; Jones et al., 2017; Monz et al., 2013; Stronza et al., 2008). Such negative effects have highlighted the importance of achieving sustainable tourism goals and taking them as the basis for the creation of management policies for the area. According to the World Tourism Organization (OMT 2012) these goals consist of satisfying the needs of visitors, industry, and host communities, considering current and future social and environmental effects.
In a periodic evaluation of a tourist destination, sustainability is essential to know the progress and impacts that tourism has generated on the environment and socioeconomic sector. Sustainability indicators are measurement tools or parameters that provide specific information about a phenomenon and allow defining objectives, challenges or demonstrating progress (Astier et al., 2008). Aggregate sustainability indexes or composite indicators are used to integrate and analyze the information of indicators (Mayer, 2008; Saisana & Tarantola, 2002; Schuschny & Soto, 2009). Through a representative and easy to understand value, the indexes allow comparing the systems studied annually and collaborating in decision-making about their management (Nardo & Saisana, 2005).
The selection of tourism sustainability indicators -even more their application- are complex processes (Asmelash & Kumar, 2019; Blancas et al., 2016; Tanguay et al., 2013). This complexity is reflected in variety of the indicator systems reported in scientific publications (Ashok et al., 2017; Choi & Sirakaya, 2006; Hashemkhani Zolfani et al., 2015; Li, 2004; Singh et al., 2009; Torres-Delgado & Saarinen, 2013; Tsaur et al., 2006; Xin & Chan, 2014) and international organization reports (WTO (World Tourism Organization) 2004; OMT 2005). Some of these systems require a great amount of information, in addition to a complex analysis method, which hinder their application and decision-making by political actors (Tanguay et al., 2013). Indicators are not universal - they depend on the study objectives, as well as availability and access to information (Astier et al., 2008). For regional or local studies, developing a list of specific indicators is a priority; such is the case of PA, marginalized areas, municipalities and coastal communities in which one of main obstacle is scarce information (Castellani & Sala, 2010; Herrera-Ulloa et al., 2003; R. Ibáñez Pérez, 2015).
This study proposes a model to evaluate the sustainable performance trend of a PA with tourism activities over a period of time, which consists of a list of indicators; in addition, a simple and detailed analysis method serves as a replicable model and collaborates in managing these tourism destinations. The study area was Loreto Bay National Park (LBNP) and its areas of influence. The analyzed period covered from 2007-2017.
1. Methods
1.1. Study area
The municipality of Loreto is located in the State of Baja California Sur (BCS), Mexico. In 2015 its population was 18 912 inhabitants, of which 88% was distributed in the municipal seat that bears the same name (GBCS (Gobierno de Baja California Sur), 2018). The productive activities in the region are agriculture, livestock, and fisheries, but tourism represents the main economic activity (Hernández Trejo et al. 2009; GBCS 2018). Hotels and restaurants are the main source of employment, while commerce is the activity that generates the most economic gains (GBCS 2018). Loreto has become an important tourist destination worldwide. In 2016 and 2017 the site experienced an increase in tourist influx (national and international) (INEGI (Instituto Nacional de Estadística y Geografía) 2016; INEGI 2017).
The LBNP covers a total surface area of 206 580.75 ha located off the coast of Loreto in the Gulf of California. This PA is characterized by a high biodiversity and endemism, which makes it one of the main tourist attractions in the region (CONANP 2002). Within the polygon, the Coronados, del Carmen, Danzante, Montserrat, and Santa Catalina islands are found, in addition to 12 islets (Figure 1). The populations that inhabit the localities in the area of influence - Loreto, San Cosme, Ensenada Blanca, Ligüí, Nopoló, and Agua Verde - depend mainly on the natural resources of the PA. This National Park has an updated Management Program, which establishes its zoning and regulation of tourism activities (DOF (Diario Oficial de la Federación) 2019).
However, tourism in LBNP may cause environmental damage, such as pollution and modification of the natural landscape and behavior of some species (CONANP 2002) besides generating socio-economic and cultural costs to residents (Mendoza Ontiveros & González Sosa, 2014).
Figure 1.
Location of Loreto Bay National Park and its areas of influence in Loreto Municipality, Baja California Sur, Mexico.
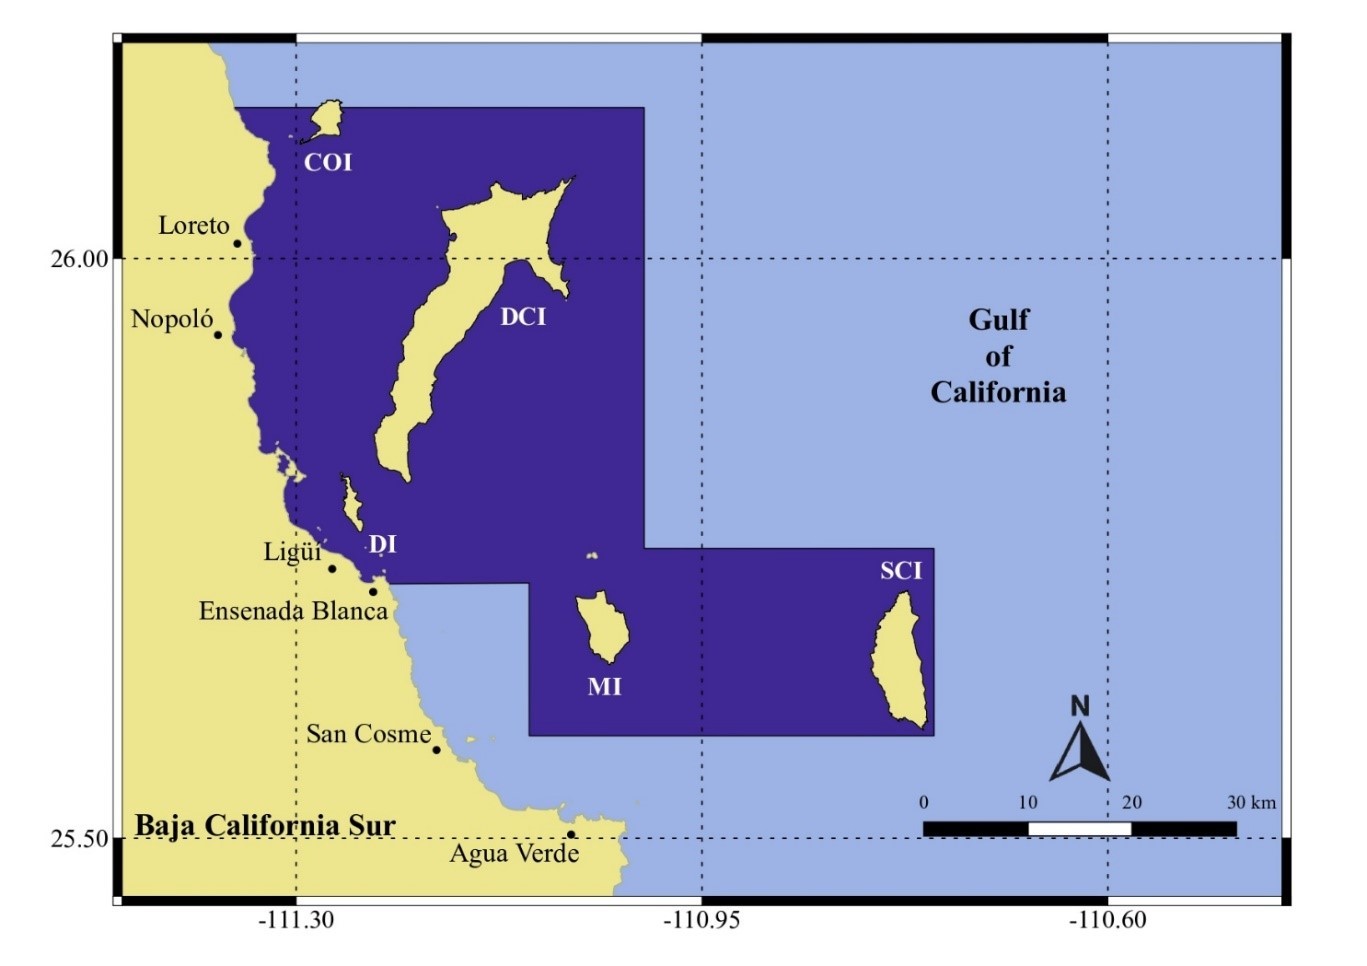
Abbreviations correspond to the names of the islands: (COI) Coronados Island; (DCI) Del Carmen Island; (DI) Danzante Island; (MI) Monserrat Island; (SCI) Santa Catalina Island. Source: Own production based on CONANP (2002).
1.2. Selection of dimensions and indicators
The selection of indicators and dimensions was performed through a review of proposed systems to evaluate sustainable development in Mexico and tourism in a PA (INEGI & [INE] Instituto Nacional de Ecología 2000; OMT 2005; Santana-Medina et al. 2013). The incorporation of indicators into the index was defined by relevance, availability, reliability and sensitivity criteria (OMT 2005). Availability of information was the criterion that discarded a greater number of variables. Finally, 28 indicators were selected and organized in four dimensions: socio-economic, tourism, environmental and technological (Table 1).
Table 1.
Sustainability indicators selected for Loreto Bay National Park (LBNP), Baja California Sur, Mexico and its areas of influence.
|
Dimension |
Indicator |
Relationship with sustainability |
|
Socio-economic |
Birthrate |
+ |
|
Population growth |
+ |
|
|
Child mortality |
- |
|
|
Working population |
+ |
|
|
Literacy |
+ |
|
|
Piped water |
+ |
|
|
Homes without overcrowding |
+ |
|
|
Locations with more than 5000 inhabitants |
+ |
|
|
Tourist |
Tours to islands |
+ |
|
Kayak services |
+ |
|
|
Recreational diving |
+ |
|
|
Resident tourism companies |
+ |
|
|
Hotel occupation |
+ |
|
|
Influx of national tourists |
+ |
|
|
Inflow of foreign tourists |
+ |
|
|
Accommodation Offer |
+ |
|
|
LBNP tourism demand |
+ |
|
|
Environmental |
Urban solid waste generation |
- |
|
Recycling |
+ |
|
|
Illicit activities |
+ |
|
|
Surveillance |
+ |
|
|
Environmental inspections |
+ |
|
|
Environmental certifications |
+ |
|
|
Budget |
+ |
|
|
Technological |
Alternative energy in tourism companies |
+ |
|
Wastewater treatment plants |
+ |
|
|
Capacity of wastewater treatment plants |
+ |
|
|
Surveillance cameras |
+ |
Source: Own production.
Social and economic indicators were classified into a single dimension, in which the variables represented demographic characteristics, health, education, employment and housing, of which the last two represented economic activity (Copus & Crabtree, 1996). Tourism dimension indicators covered supply and demand activities. Demand variables indirectly reflect income generation, so the economic component was also implicit in tourism dimension. The environmental dimension included impact and response indicators to LBNP and its areas of influence, which included surveillance and inspection actions, as well as budget received for PA conservation. These activities are carried out by management institutions of the area, so political issues are addressed. Technological dimension is not commonly incorporated into sustainability assessments, but it represents the way through which natural resources are obtained and transformed to meet the needs (Cabezas et al., 2003). Therefore, technology may positively influence tourism development through communication and transportation systems (Choi & Sirakaya, 2006; WTO (World Tourism Organization), 2011).
1.3. Information Collection
Data were obtained from monitoring and records performed by Instituto Nacional de Estadística, Geografía e Informática (INEGI), Consejo Nacional de Población (CONAPO), Secretaría de Turismo (SECTUR), CONANP, Eco-Alianza de Loreto, Procuraduría Federal de Protección al Ambiente (PROFEPA) and Comisión Nacional del Agua (CONAGUA). This information was collected through five sources: (1) statistical yearbooks and strategic information documents; (2) data provided directly by the administrative office of the LBNP; (3) data provided by Eco-Alianza de Loreto, civil organization; (4) applications through the National Transparency Platform; and (5) censuses to resident tour operators in Loreto and Nopoló localities.
1.4. Index construction and statistical analysis
Annual indicator values were organized in a matrix. The treatment of missing information consisted of linear regressions to replace missing values in the socioeconomic indicators. The General Sustainability Index (GSI) calculation consisted of adapting a methodology of Human Development Index (HDI) (Anand & Sen, 1994). The indicator values were standardized to unify magnitudes and make them comparable (Nardo & Saisana, 2005). The relativization method was used based on maximum and minimum values observed within the time series data; each indicator took values from zero to one. Equation 1 was used for indicators with a positive relationship with sustainability, while for those with negative relationship, Equation 2 was used.
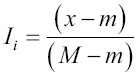 (1)
(1) 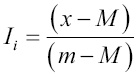 (2)
(2)
Where:
 = Standardized value of each indicator
 = Observed value of each indicator
 = Minimum value of the indicator
 = Maximum value of the indicator
The sustainability Index (SI) by dimension for each year was obtained by arithmetic average of each dimension indicator (Equation 3). The SI varies from zero to one. As value approaches one, the dimension has better performance and the sustainability level is higher.
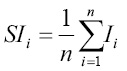 (3)
(3)
Where:
= Standardized value of each indicator
 = Number of indicators for each dimension
The sustainable performance trend during the period of study was analyzed using annual values of the GSI. Calculation of this index consisted of an additive aggregation method using the arithmetic average of the four SI, whose assigned weight was the same for the four dimensions (Equation 4). One of the conditions of this aggregation method was the absence of dependence or strong interaction between variables (Gan et al., 2017), which was fulfilled since the values corresponded to the SI of each dimension. GSI took values from zero to one.
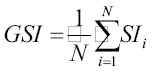 (4)
(4)
Where:
 = Number of dimensions
 = Sustainability Index of each dimension
Normality of data were tested using Shapiro Wilk. Given the non-normal distribution of the data, Spearman correlation matrices were performed to determine positive and negative relationships among the four-dimensional indicators (Daniel, 2008). Statistical significance was considered when α ≤ 0.05. Indicators with the greatest contribution to the SI were identified with the principal component analysis (PCA). The determination coefficient (R2) was obtained by the squared factor loading of each indicator (Guerrero de Lizardi, 2008).
In ecological and sustainability indexes a high correlation is commonly found between indicators; although the indicators are correlated, they are relevant and contribute independently to the sustainability of the system (Dormann et al., 2013; Gan et al., 2017). The multiple regression analysis requires absence of autocorrelation (Gujarati & Porter, 2010); the PCA offers an alternative since one of its assumptions is that original variables are correlated to generate new non-collinear variables (Dormann et al., 2013). Prior to each PCA, a strong association between variables (α ≤ 0.05) was tested using Barlett sphericity for each dimension. Kaiser-Meyer-Olkin (KMO) sample adequacy test with values greater than 0.5 indicated that the data was suitable for analysis (Guerrero de Lizardi, 2008). Statistical analyses and their graphic representation were performed using SPSS (Statistical Program for Social Sciences, 20 version) software.
2. Results
2.1. Socioeconomic dimension
Except for population growth and birth rate, the trend of socioeconomic indicators during the period was positive, which was reflected in an increase in SI (Figure 2). The PCA grouped the indicators into two principal components (PC), which together represented 84% variance of the data. According to R2, the indicator with the highest contribution to socioeconomic SI was literacy percentage (Table 2). Employment, education and housing indicators showed positive correlations between some tourism offer indicators (number of companies offering tourist services and number of resident tourism companies) (Table 7 in the Appendix).
Figure 2
Sustainability Index (SI) trend of socioeconomic dimension, from 2007-2017.
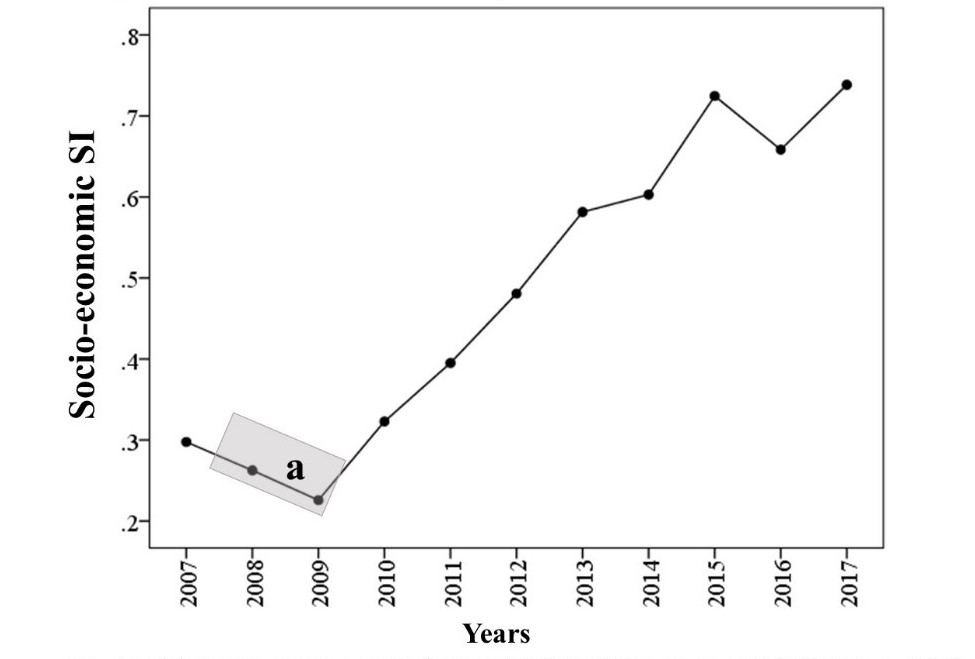
a) Infant mortality increases and population growth decrease. Source: authors’ elaboration.
Table 2.
Factor loadings of Principal Components (PC) and determination coefficients (R2) for socioeconomic dimension in Loreto Bay National Park, Baja California Sur, México.
|
Indicators |
Factor loadings |
R2 |
|
|
PC1 |
PC2 |
||
|
Birthrate |
-.895 |
-.275 |
0.805 |
|
Population growth |
-.480 |
.396 |
0.230 |
|
Child mortality |
.268 |
.866 |
0.072 |
|
Working population |
.975 |
-.032 |
0.951 |
|
Literacy |
.989 |
-.105 |
0.979 |
|
Piped water |
.965 |
-.010 |
0.932 |
|
Homes without overcrowding |
.974 |
-.122 |
0.948 |
|
Locations with more than 5000 inhabitants |
.897 |
-.027 |
0.805 |
Factor loadings > 0.50 were considered significant (in bold).
2.2. Tourism dimension
All tourism offer indicators showed a positive trend during the period of study and a positive correlation with the GSI (Table 6). The only demand indicator with positive trend was the number of tourists visiting the LBNP. The two PC accumulated variance of 87%. The first component had a positive correlation with offer indicators and a negative one with two tourism demand indicators. In contrast, the second component showed a positive correlation with tourism demand indicators (Table 3). National tourist influx and hotel occupancy showed a negative trend during the period and a negative correlation with SI (Table 3; Figure 3).
Figure 3.
Sustainability Index (SI) trend of tourism dimension, from 2007-2017.
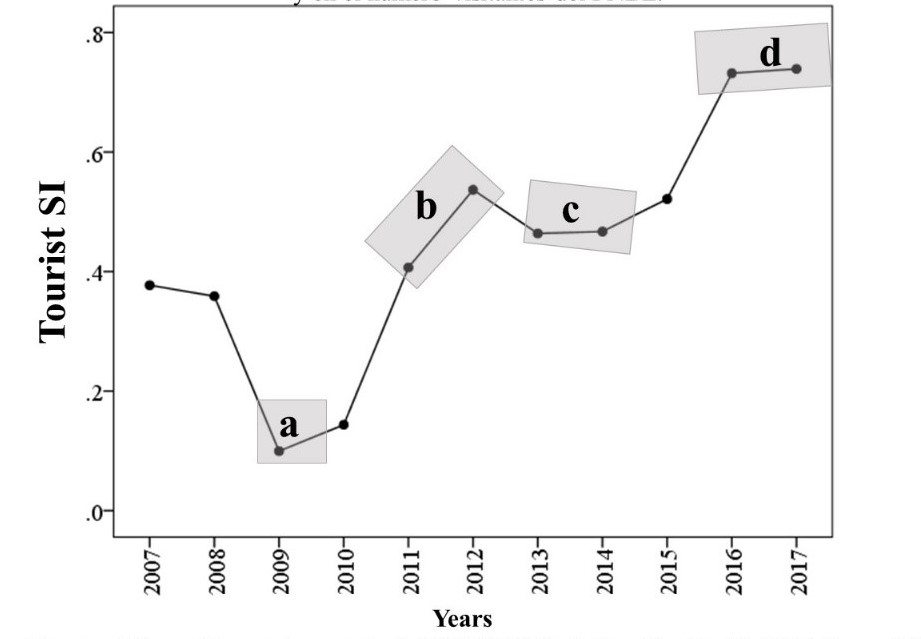
(a) Decrease in tourist influx and hotel occupancy due to economic crisis; (b) increase in tourism offer; (c) decrease in tourism offer and tourism influx; (d) increase in the number of visitors and the number of Loreto Bay National Park (LBNP) visitors. Source: authors’ elaboration.
Table 3.
Factor loadings of Principal Components (PC) and determination coefficients (R2) for tourism dimension in Loreto Bay National Park, Baja California Sur, México.
|
Indicators |
Factor loadings |
R2 |
|
|
PC1 |
PC2 |
||
|
Tours to islands |
.959 |
.220 |
0.9203 |
|
Kayak services |
.956 |
.197 |
0.9139 |
|
Recreational diving |
.934 |
.181 |
0.8720 |
|
Resident Tourism Companies |
.913 |
.225 |
0.8342 |
|
Hotel occupation |
-.822 |
.553 |
0.6763 |
|
Influx of national tourists |
-.751 |
.604 |
0.5634 |
|
Inflow of foreign tourists |
-.064 |
.969 |
0.0041 |
|
Accommodation Offer |
.967 |
.142 |
0.9345 |
|
LBNP tourism demand |
.106 |
.549 |
0.0112 |
Factor loadings > 0.50 were considered significant (in bold).
2.3. Environmental dimension
Five of the seven environmental indicators showed a positive trend with irregular variations, which is reflected in the SI (Figure 4). The PCA grouped the indicators in four CP with a cumulative variance of 94.4%. Indicators with the highest contribution to the SI were environmental certifications, followed by waste recycling and urban solid waste (USW) generation (Table 4). These three indicators also showed a positive correlation with the GSI (Table 4). Both illegal and surveillance actions decreased in 2015 and showed their peak in 2017 (Figure 4). Surveillance actions showed a negative correlation with the number of companies offering tourism tours (Table 7 in the Appendix).
Figure 4.
Sustainability Index (SI) trend of environmental dimension, from 2007-2017.
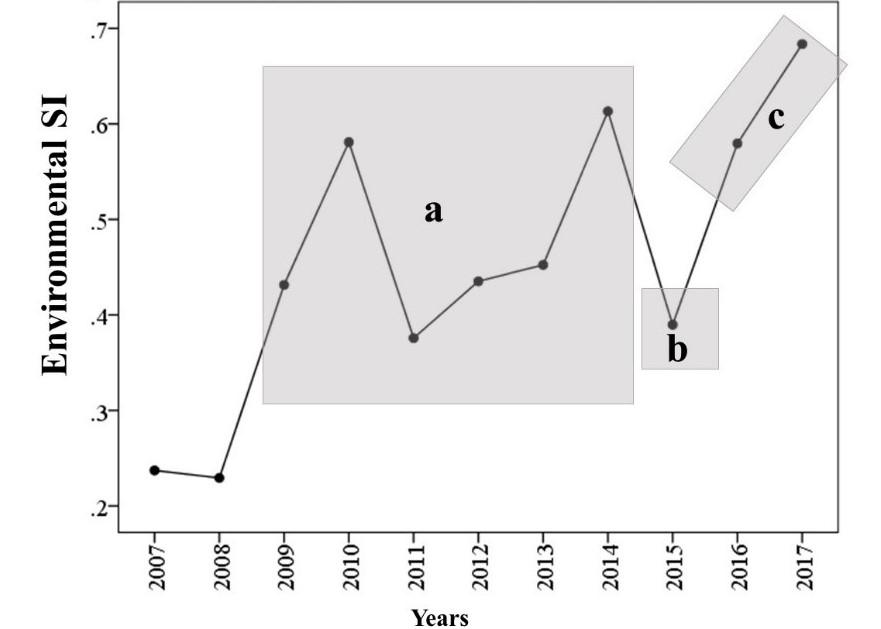
(a) Irregular variations; (b) decrease in surveillance and detection of illegal actions; (c) increase in surveillance, illegal actions and environmental certifications. Source: authors’ elaboration.
Table 4.
Factor loadings of Principal Components (PC) and determination coefficients (R2) for environmental dimension in Loreto Bay National Park, Baja California Sur, México.
|
Indicators |
Factor loadings |
R2 |
|||
|
CP1 |
CP2 |
CP3 |
CP4 |
||
|
Urban solid waste generation |
.786 |
-.020 |
.564 |
.066 |
0.619 |
|
Recycling |
.825 |
-.039 |
-.339 |
.323 |
0.681 |
|
Illicit activities |
.289 |
.651 |
-.358 |
.571 |
0.084 |
|
Surveillance |
.217 |
.772 |
.522 |
-.186 |
0.047 |
|
Environmental inspections |
-.656 |
.616 |
-.228 |
-.261 |
0.431 |
|
Environmental certifications |
.934 |
.065 |
-.043 |
-.260 |
0.873 |
|
Budget |
-.588 |
-.060 |
.481 |
.631 |
0.346 |
Factor loadings > 0.50 were considered significant (in bold).
2.4. Technological dimension
The four indicators considered in this dimension showed a positive trend, and three of them showed a positive correlation with the GSI (Table 6). The PCA generated only one PC with a variance of 80%. The indicators that showed a higher correlation with the component were the number of wastewater treatment plants and their capacity (Table 5; Figure 5).
Figure 5.
Sustainability Index (SI) trend of technological dimension, from 2007-2017.
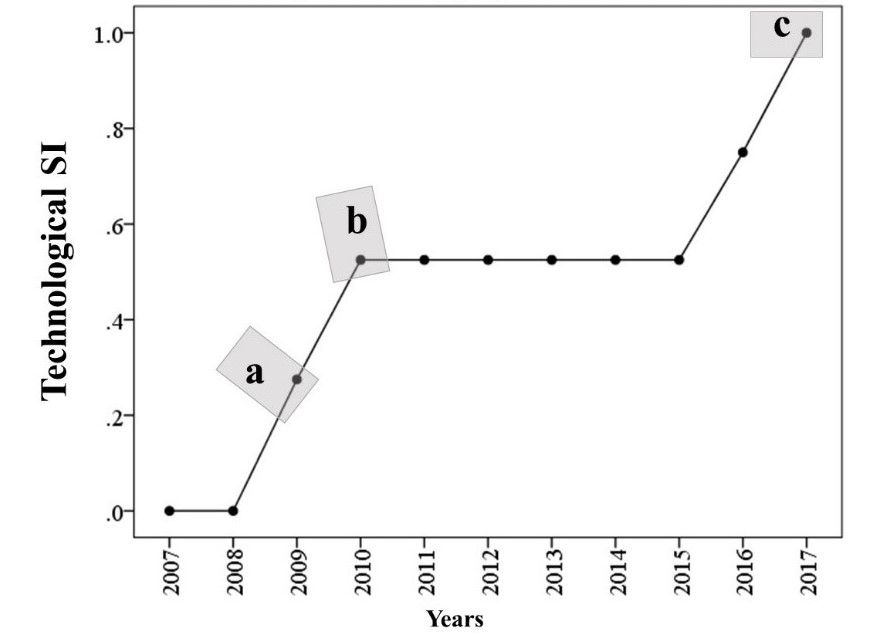
(a) Increase in the number of wastewater treatment plants and their capacity; (b) increase in the use of alternative energy; (c) implementation of surveillance camera. Source: authors’ elaboration.
Table 5.
Factor loadings of Principal Components (PC) and determination coefficients (R2) for technological dimension in Loreto Bay National Park, Baja California Sur, México.
|
Indicators |
Factor loadings |
R2 |
|
CP1 |
||
|
Alternative energy in tourism companies |
.794 |
0.631 |
|
Wastewater treatment plants |
.970 |
0.941 |
|
Capacity of wastewater treatment plants |
.969 |
0.940 |
|
Surveillance cameras |
.591 |
0.350 |
Factor loadings > 0.50 were considered significant (in bold).
2.5. General Sustainability Index (GSI)
The GSI increased within the period of study after a decrease in 2008. However, it showed irregular variations that corresponded to IS of environmental and tourism dimensions (Figure 6).
Figure 6.
General Sustainability Index (GSI) trend, from 2007-2017.
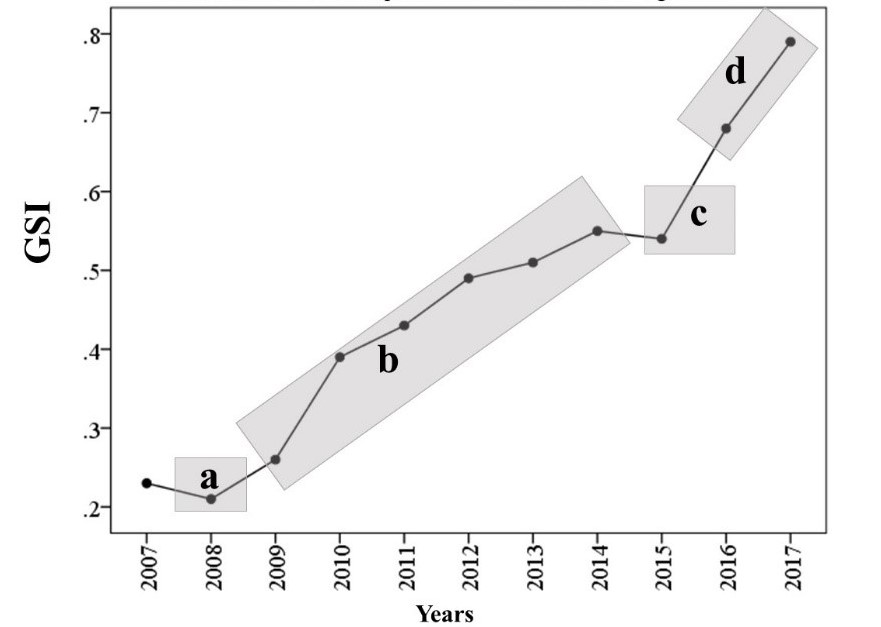
(a) Economic crisis; (b) irregular variations related to tourism and environmental SI; (c) decrease in environmental monitoring and budget allocated; (d) increase in monitoring, certification, tourism in Loreto Bay National Park (LBNP) and implementation of surveillance camera. Source: authors’ elaboration.
Table 6.
Significant correlations (p <0.05) between General Sustainability Index (GSI) and indicators of the four dimensions in Loreto Bay National Park, Baja California Sur, México.
|
Dimension |
Sustainability indicator |
Correlation coefficient |
|
Socio-economic |
Birthrate |
-0.834 |
|
Population growth |
0.921 |
|
|
Literacy |
0.955 |
|
|
Piped water |
0.890 |
|
|
Homes without overcrowding |
0.909 |
|
|
Locations with more than 5000 inhabitants |
0.938 |
|
|
Tourism |
Tours to islands |
0.831 |
|
Kayak services |
0.883 |
|
|
Recreational diving |
0.743 |
|
|
Resident Tourism Companies |
0.977 |
|
|
Accommodation Offer |
0.970 |
|
|
Environmental |
Urban solid waste generation |
0.626 |
|
Recycling |
0.897 |
|
|
Environmental certifications |
0.840 |
|
|
Technological |
Alternative energy in tourism companies |
0.775 |
|
Wastewater treatment plants |
0.858 |
|
|
Capacity of wastewater treatment plants |
0.858 |
3. Discussion
3.1. Socioeconomic dimension
The positive trend of socioeconomic indicators suggests an improvement in education, employment and housing, which agrees with the marginalization index categorized as very low for Loreto from 2000 to 2015 (CONAPO 2016). This parameter measures the lack of opportunities for development and progress of a social group or geographic area, which indicates that the population of Loreto has maintained a high level of well-being (Téllez Vázquez et al., 2016). In contrast, the town of Cabo Pulmo in Mexico, which houses a PA with the same name, lacks basic services such as drainage, roads in good condition, health and education; therefore, it has been classified with a high marginalization index (R. Ibáñez Pérez, 2015).
Infant mortality rate was used to assess the population health status (Reidpath & Allotey, 2003)however, are more complex, and for resource poor countries, this added burden could mean diverting funds from much needed programmes. Unfortunately, the conjecture, that DALE is a better measure of population health than IMR, has not been empirically tested. Methods: IMR and DALE data for 1997 were obtained from the World Bank and the World Health Organisation, respectively, for 180 countries. Findings: There is a strong (generally. The positive trend of this indicator (given its standardization), evidenced a decrease in the number of deaths of children under one year of age from 2007-2017, which was consistent with the increase in population percentage with health insurance (from 75-88%) from 2010-2015 (INEGI 2010; INEGI 2017).
Population growth showed a decrease during the period of study. This indicator has been considered as an economic growth factor (Peterson, 2017). However, in developing countries, such as Mexico, it could have a negative impact on sustainable development (Güney, 2017). Negative effects, both environmental and socioeconomic, are related to the increase in resource consumption, as observed in Nigeria, where the increase in population growth and birth rates have led to a rise in poverty, as well as an excessive use of natural resources (Ngoka, 2013).
The decrease in birth rate agreed with national values during the same period, which was due to implementing family planning programs and increasing the use of contraceptive methods (SS (Secretaría de Salud) 2015; INEGI 2017). In addition to a negative correlation with the GSI, birth rate showed an R2 of 80%, which means that it had an important contribution in the SI. In Loreto, 80% of the population are native to the State of BCS, and at national level the state has one of the lowest emigration rates (Ganster et al. 2007; CONAPO 2015; Gordillo & Plassot 2017). Therefore, the negative trend of population growth is mainly related to a decrease in birth rate.
3.2. Tourism dimension
One of the goals of sustainable tourism is to improve life quality of the host community (OMT 2005). The positive correlation between life quality and some tourism offer indicators represent a benefit to local community. Tourism benefits on the life quality of residents in BCS have been reflected in studies conducted with coastal communities that host a PA, such as El Vizcaíno Biosphere Reserve and Cabo Pulmo National Park. Regarding the first PA, visitors who take tours to Laguna Ojo de Liebre and Laguna de San Ignacio for whale-watching, generate an economic gain of approximately USD $3 million dollars per season; which benefits the local community, mainly operators and tour guides (Brenner et al., 2016). Likewise, in the town of Cabo Pulmo, residents occupy 89% of the jobs within the tourism sector, which generate a socio-economic benefit (R. Ibáñez Pérez, 2015). In this study, the indicators that showed a positive correlation with residents’ life quality were the number of companies that offer tourism services. This result was consistent with a study conducted about Loreto residents’ perception where the results reflected that tourism provided benefits through direct and indirect employment generation (Mendoza Ontiveros & González Sosa, 2014).
Tourism offer indicators showed a strong contribution to the SI, where more than 80% of its variance was explained by the index, thus assuming that these variables have contributed to the sustainable development of the site. The number of tourists visiting the LBNP was the only demand indicator with positive trend; these data are annual and come from the sale of bracelets through CONANP. Since 2014, each of the beaches, trails and dive sites within the LBNP have had their own established carrying capacity (CONANP 2016). These data indicate the maximum number of people who can make use of the site without causing damage, so they represent a useful tool for management and conservation of the area, besides helping to identify the areas that need more attention (González-Guerrero et al., 2016; R. Ibáñez Pérez, 2016). The number of LBNP visitors suggests that carrying capacity has not exceeded; however, this registration is annual and does not specify the degree of visitation in each of the sites. An effective implementation of carrying capacity requires that political actors and responsible institutions perform the application of specific measures. Likewise, the value of carrying capacity should be made known to tour operators (Coccossis & Mexa, 2002), so they can keep track of the number of visitors allowed.
The decrease in tourism influx in 2009 coincides with the global financial crisis in 2008 in the United States (Zurita González et al., 2009). However, one of the main factors that influence low tourism influx is destination location (De Sicilia Muñoz, 2000). Loreto is located within the same federal entity as Los Cabos, one of the main tourist destinations at international level (SECTUR et al. 2014), which has a greater offer of services and air connectivity (R. Ibáñez Pérez et al., 2016). In contrast, access to Loreto is hindered by the low flight supply (Mendoza Ontiveros & González Sosa, 2014). The economic benefits of tourism have been evident and reported in resident perception studies (Andereck et al., 2005; Ávila Foucat, 2002; Rivera & Lee, 2016; Sharpley, 2014)but few cases have shown this to be sustainable. This paper assesses the sustainability of the Ventanilla community-based ecotourism management (CBEM, confirming the need to increase tourism demand. However, uncontrolled growth in the number of visitors, poor vigilance and deficiency in legislation application may generate damages for the environment and resident population (Buckley, 2011; Chávez Ramírez & de la Cueva Salcedo, 2010; Eagles et al., 2002; Monz et al., 2013). Such is the case of the municipality of Los Cabos in Mexico, whose growth in tourism development has generated several problems, such as vehicle traffic, water scarcity, deficiency in solid waste disposal, pollution of natural areas, loss of traditional activities, as well as economic growth oriented towards investors and not residents (Montaño et al., 2016). On the other hand, low tourism influx, and therefore moderate tourism development, may generate advantages, such as greater security, less pollution and agglomeration, as well as less poverty (Almeida García et al., 2015; Andereck et al., 2005)
3.3. Environmental dimension
Due to lack of data, the information on environmental indicators was obtained from different public and civil organization sources. These institutions differ in their collection method of data, organization, and publication period, which could affect trend and variation. The scarce information on environmental indicators has been previously reported in a sustainability study in BCS (Herrera-Ulloa et al., 2003).
According to the perception of hotel managers in London and other tourism enterprises in West of England, environment certifications offer advantages, such as providing information about the implementation of sustainability practices, cost-savings by implementing these practices, increasing company competitiveness as tourists become more aware of the environment, and reducing environmental impacts (Geerts, 2014; Jarvis et al., 2010). Although this indicator showed a positive trend and a high contribution to the SI, none of these certifications were obtained by hotels or tour operators.
The generation of urban solid waste (USW) has a negative relationship with sustainability; pollutants that occur in dumps could cause environmental and aesthetic damages, which may affect the image of a tourist destination (Kiss Köfalusi & Encarnación Aguilar, 2006). This problem has been observed in some PA with tourism activity, such as Parque Estatal El Ocotal and Parque de los Venados, in the State of Mexico, where solid waste generation and dispersion was one of the main environmental damages (Pérez Ramírez et al., 2009). Therefore, the positive correlation of this indicator with the GSI indicates the decrease in USW generation in Loreto, which is related to an increase in sustainability.
The amount of waste received for recycling is a management indicator. A positive trend and correlation with the GSI indicate that an increase in the amount of waste received by collection centers is related to a rise in sustainability. According to SEMARNAT et al. (2013), 34% of USW generated in Loreto was recyclable waste, while 41% could have been used for composting. Therefore, if the disposal of recyclable waste increased in collection centers, the amount of USW would decrease by more than 50%.
Responsible institutions for conducting surveillance and detecting illegal actions in the LBNP are CONANP and PROFEPA; therefore, if surveillance decreases, the record of illegal actions also decreases, which agrees with a study conducted in the Kakum National Park in Ghana where the increase in patrol efforts was found related to an increase in detecting illegal wildlife capture and hunting. This result was due to a reduced surveillance period, as well as the distance traveled (Wiafe, 2016). Therefore, as indicated by Miller et al. (2013)control and surveillance (MCS, monitoring and surveillance activities are necessary tools to detect and prevent illicit actions.
3.4. Technological dimension
Records indicated that the number of tourists, lodging units, and tourism companies have increased in the last two years of the study period, which suggests a possible increase in water consumption and subsequent competition for resources with residents (Mendoza Ontiveros & González Sosa, 2014). Therefore, an efficient wastewater treatment allows a percentage of water to be reused, reducing the consumption rate and environmental impacts that could be generated by treated water disposal at sea (Gössling et al., 2012)direct tourism-related water use is considerably less than 1% of global consumption, and will not become significant even if the sector continues to grow at anticipated rates of around 4% per year (international tourist arrivals. The increase in number and capacity of wastewater treatment plants suggested that despite the possible increase in consumption, the amount of water being treated and reused was greater.
In Loreto, technological innovation within the tourism sector is deficient, mainly that related to alternative energy. This municipality has important sources of renewable energy, such as solar radiation and wind; however, as observed in the results, its use is still limited. Generally, this situation might be due to the lack of knowledge about the advantages of this type of energy, as it has occurred in other regions of the country, such as in the Caribbean (Breceda et al., 2007; Schlüter, 1996). The economic benefits provided by renewable energy in the medium and long term are greater, such as a decrease in costs and the possibility of generating a self-sufficient system (Jiménez Castilla, 2014; Schlüter, 1996). In addition, it is also an indicator of good sustainable practices and one of the standards for obtaining environmental certifications, which could help generate greater competitiveness (EarthCheck, 2018; Jarvis et al., 2010).
An essential component for a PA management with tourism is the continuous monitoring of visitors. Surveillance actions and the number of staff needed may require a high cost, especially if it is a Marine Protected Area (Leung et al., 2015). According to CONANP the same year that a surveillance camera was installed in Loreto port, the number of illegal actions increased, mainly those related to fishing and tourism (Pronatura, 2018), which indicated that the application of this instrument was successful. Other studies have used aerial vehicles with the same surveillance function in a Marine Protected Area; this technology offers advantages, such as a decrease in fuel consumption and working hours during patrols (Arefin, 2018).
4. Recommendations
The study has shown LBNP sustainability, and its areas of influence increased from 2007-2017. Although the SI reflected a positive trend in all dimensions, the socioeconomic one showed the least variation. To continue generating socio-economic benefits to the local community, governmental agencies and civil organizations should support and work jointly with local businesses.
Irregular variations in tourism SI are mainly due to demand indicators. To increase tourist influx and hotel occupancy, efforts should be focused towards promotion and connectivity of the tourist destination - the latter through the increase in flight offer. Nevertheless, tourism demand may also generate costs, which should be considered and prevented. Control over the number of visitors to LBNP is greatly important and could be achieved through constant communication with tour operators, as well as by recording visitation at each of the sites in the area, avoiding in this manner exceeding carrying capacity.
Certification number was the environmental indicator with the greatest contribution to the SI, as well as a high correlation with GSI. Therefore, hotel and tour operators should be encouraged to obtain environmental certifications. Generation and management of USW showed positive results; however, it is necessary to continue promoting USW sustainable management, including responsible disposal, reduction in waste generation and recycling. In future studies, the indicators that reflect the state of the system should be implemented, such as sea water quality on beaches, emission of greenhouse gases, as well as energy and drinking water consumption. Besides surveillance cameras, another technological indicator that should be promoted in Loreto is renewable energy use by hotels and tour operators. This decision would be reflected in a decrease in environmental impact indicators, such as the consumption of electrical energy and greenhouse gases emissions.
One of main obstacles during this study was information availability at municipal level and even more at PA level. Therefore, in future studies the use of indicators, such as those discussed here, should be a guide to modify them accordingly to the study area and data availability.
5. Conclusion
This study represents a novel approach to evaluate the performance of nature-based tourism sustainability in a PA using indicators. Its main contributions are discussed next. First, most works about tourism sustainability have focused on determining the system state at a certain time; however, the process by which a level was reached is unknown. In this study, the data came from economic censuses or environmental monitoring carried out within a period of time, and the trend of indicators and indexes was known; in this manner, success stories may be detected, as well as main issues where efforts should be focused. A second contribution of the method was data standardization, which allowed comparing indicators with different measurement units. In addition, establishing maximum and minimum values was not required, which are generally not available locally. Third, this study considered indicators of the three pillars of sustainability (social, economic, and environmental) besides tourism and technological dimensions; therefore, the model covered topics of all dimensions that influence sustainable tourism development. Finally, the method measured with statistical significance the contribution degree of the indicators to SI by using a PCA. Therefore, this instrument can be used to evaluate PA management with visitors and assist in decision-making.
Acknowledgments
This study was funded by Centro de Investigaciones Biológicas del Noroeste S.C. (CIBNOR, PPAC). The authors thank Eco-Alianza de Loreto A.C., administrative and operational staff of the Loreto Bay National Park; tourism companies of Loreto for their willingness, support and providing valuable information for the development of this study and Diana Fischer for editorial services.
Funding
This study was supported by Centro de Investigaciones Biológicas del Noroeste S.C. (CIBNOR, PPAC).
Declaration of data availability
The data used to report the research results are available and can be accessed by requesting them to the email idelcastillo@pg.cibnor.mx.